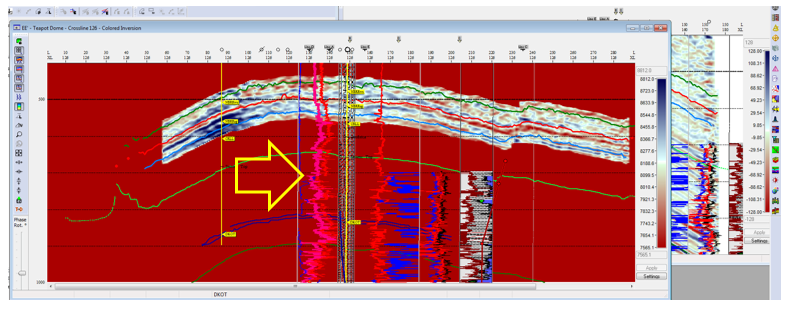
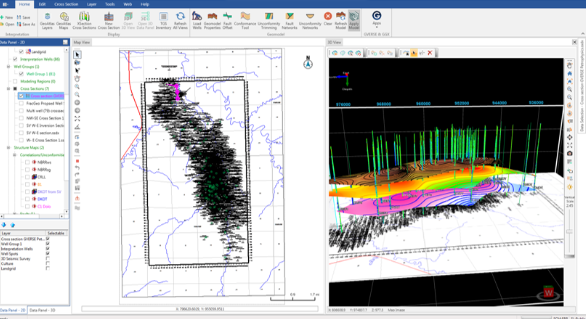
GVERSE Petrophysics is a 64-bit petrophysical application designed to assist geoscientists and petrophysicists in analyzing and interpreting well log data and characterization of the reservoir using simple to advanced log interpretation workflows in a large multi-well, multi-user environment. GVERSE Petrophysics supports the import of digital data from numerous sources and provides you with integrated data views and analysis. GVERSE Petrophysics has a close interaction with a lot of the modules in GVERSE GeoGraphix, where the interpreter can create any petrophysical template or analysis and display them in a map, cross-section, or seismic interpretation without importing and exporting the data. While working on a petrophysical interpretation, the user could import different curve data, create different curve sets, and use the different curve sets in the same template, displaying different types of information at the same time, making the interpretation more robust. This blog will explain step by step how to use and apply Curve Set Independence for Log Templates in GVERSE Petrophysics:
- Activate a project in GVERSE GeoGraphix and click on the GVERSE Petrophysics icon on the toolbar.
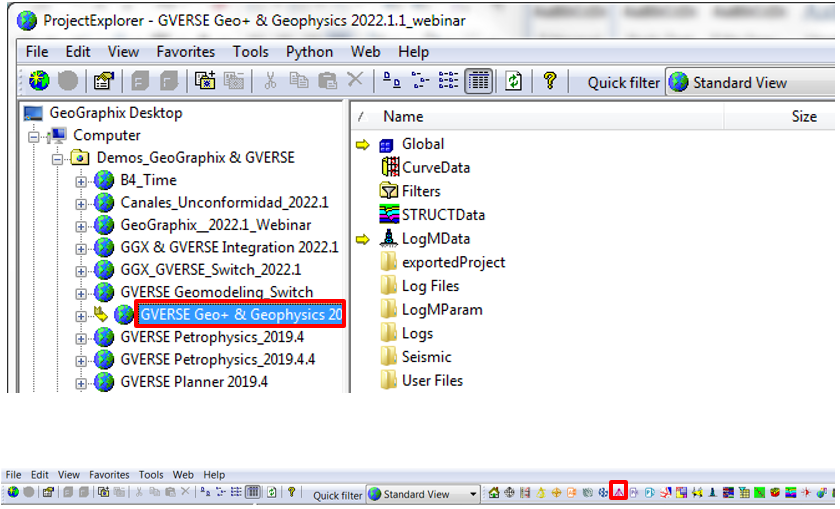
- GVERSE Petrophysics will open and a window displaying what’s new in the installed version will display. Click CLOSE.

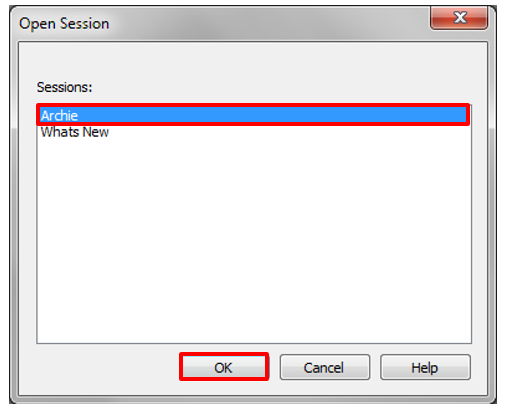
- If a session was saved the Open Session window will open. Select any of the sessions (interpretations) and click OK.
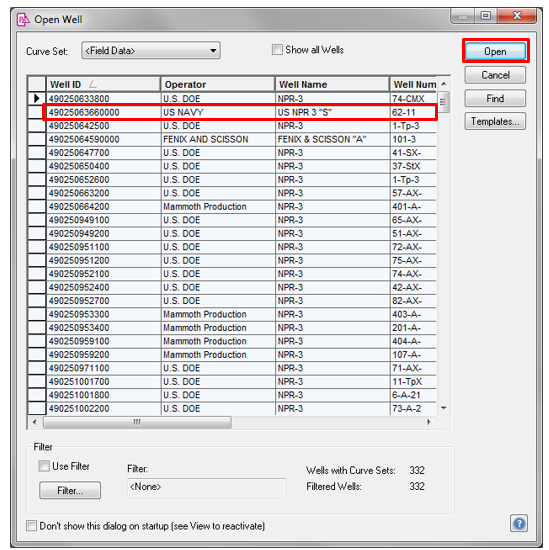
- If the project does not have a session saved, the Open Well window will appear. Select a well from the list and click Open.
- GVERSE Petrophysics will open.
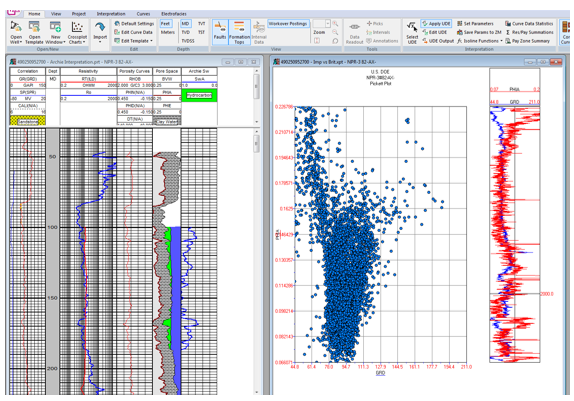
- Close any extra windows if necessary. Go to the Curves tab and click on Edit Curve Data.

- The Edit Curve Data window will open.
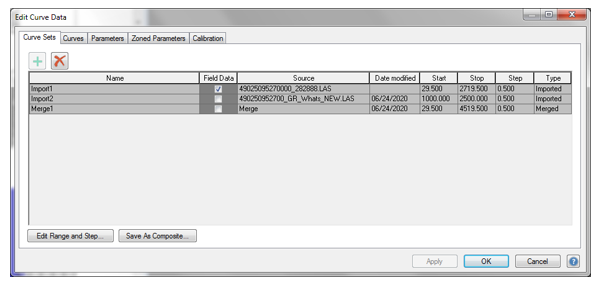
- Additionally, you can also go to Home tab and click on Edit Curve Data.

- The Edit Curve Data window will open and all the imports or merge will display in a list. Here you can view general curve set information (Name, Source, Start, Stop and Step) and select which curve set to use as the Field Data in the active well.
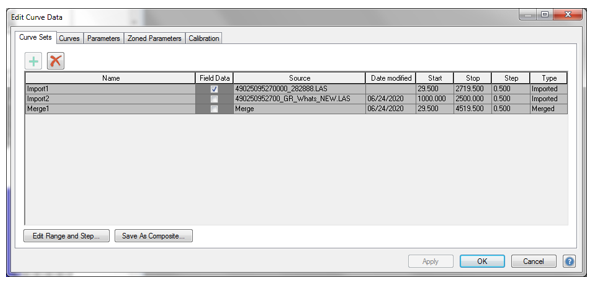
A curve set is a set of related curve data and its associated parameters. Curve Sets are created in a number of ways, as discussed below. At any one time, a single Curve Set is active, and only curves related to that curve set and wells containing that curve set are displayed in GVERSE Petrophysics. There are two primary types of curve sets created and used in GVERSE Petrophysics: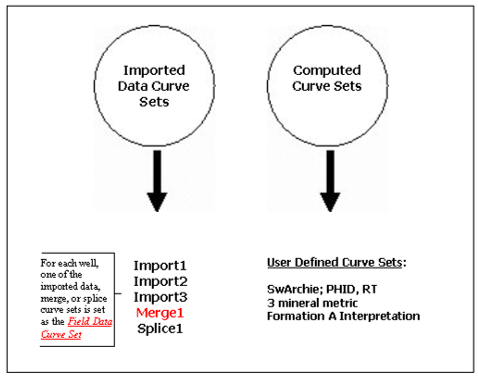
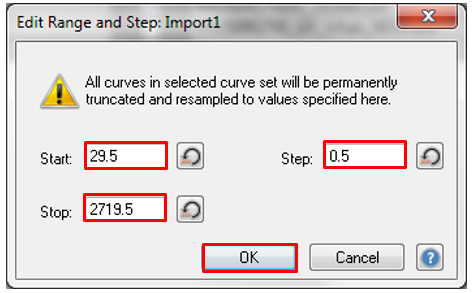
- Click on the Edit Range and Step: Import1 window to apply any changes you want and click OK.
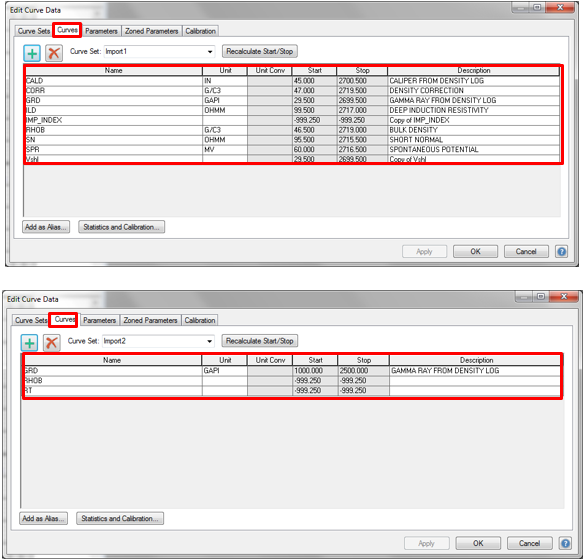
- Click the Curves tab to see the curves associated with the different imports, add extra curves to the imports if necessary and click OK.
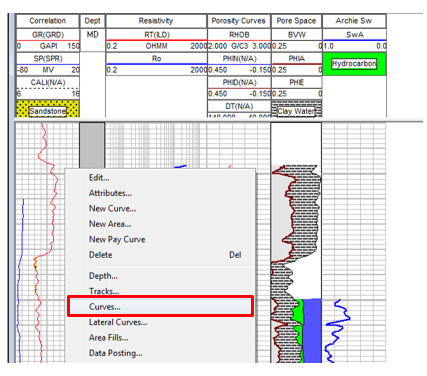
- Return to the template and right-click on top of any track and click Curves.
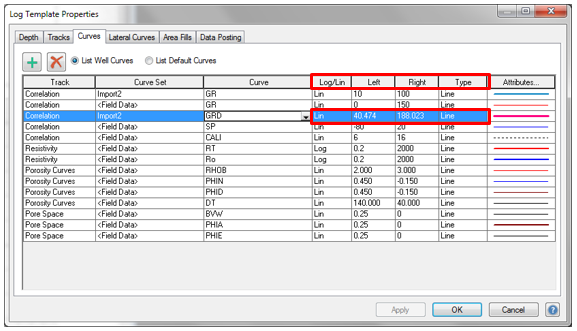
- The Log Template Properties window will open. If the Curves tab is not active click on it.
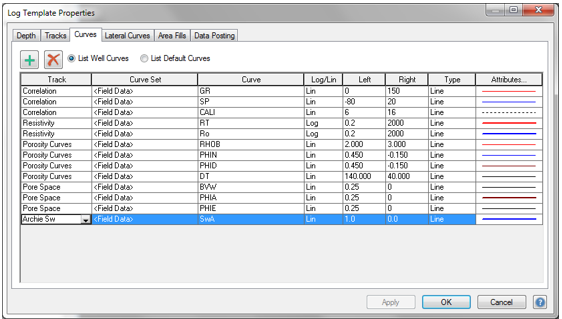
- Click the green plus sign to add a new row and add a new curve to the template.
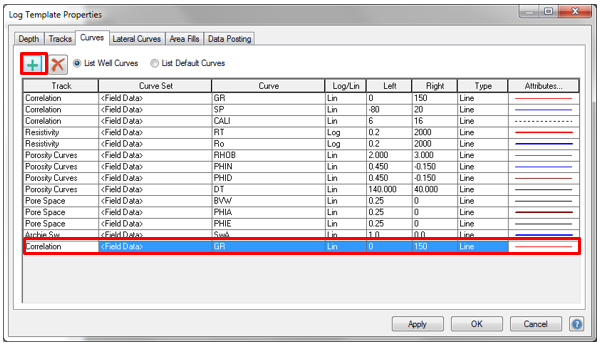
- In the Curve Set column click the drop menu and select the import or merge to be used (by default Field Data will appear).
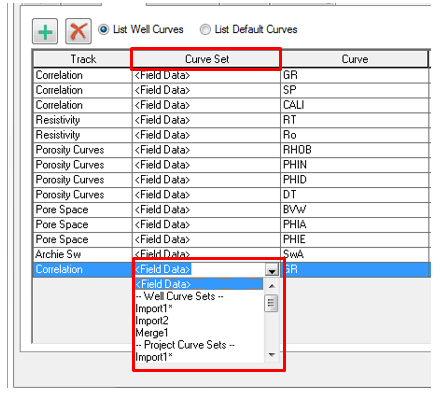
- In Curve column select the curve from the import list selected on the curve set. Only the curve inside the curve set selected will appear in this list.
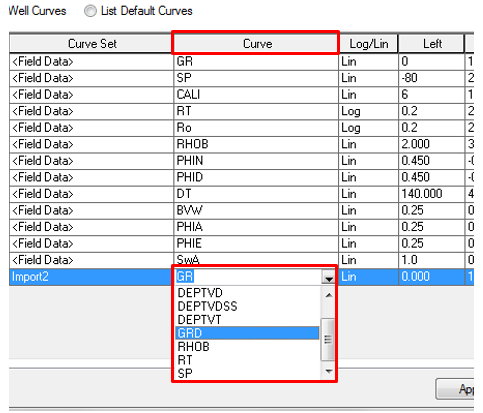
- Click on the Left, Right, Type columns and apply any changes.
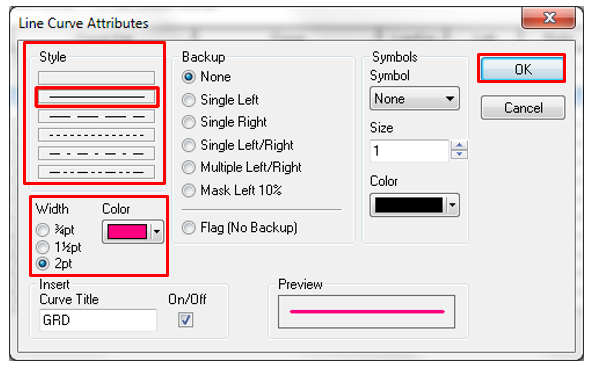
- Click the attributes tab to open the Line Curve Attributes window and change the curve color, style, symbols, etc. if necessary. Click OK.
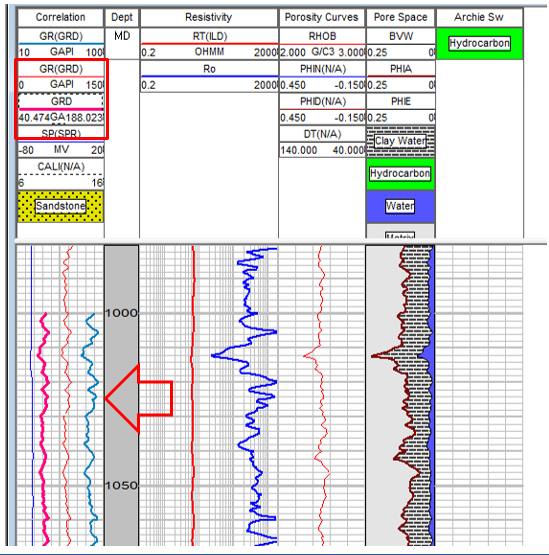
- The curve(s) from the different curve sets will display on the template.
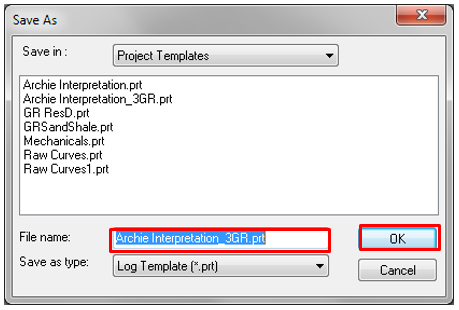
- If you want to save the changes in the template click on the GVERSE Petrophysics icon, go to Save As and click Save as Template.
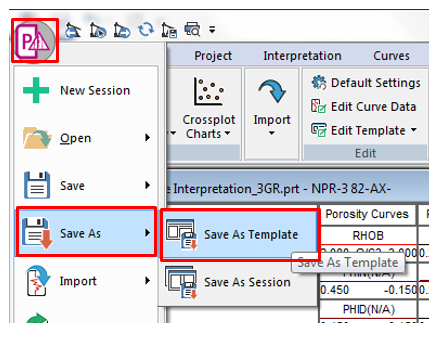
- The Save As window will open. Add a new name or select a name from the list and click OK.
- Open GVERSE Geo + and open a session if you have any or create a new one.
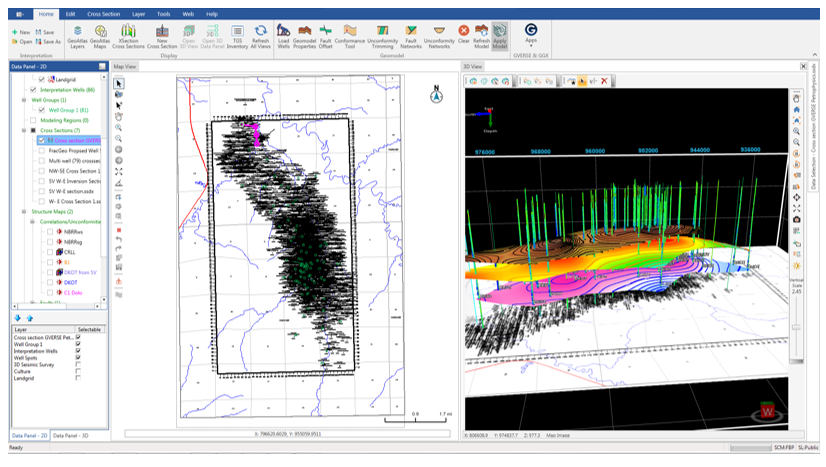
- Open or create a cross section in GVERSE Geo+ and activate saved template in GVERSE Petrophysics.
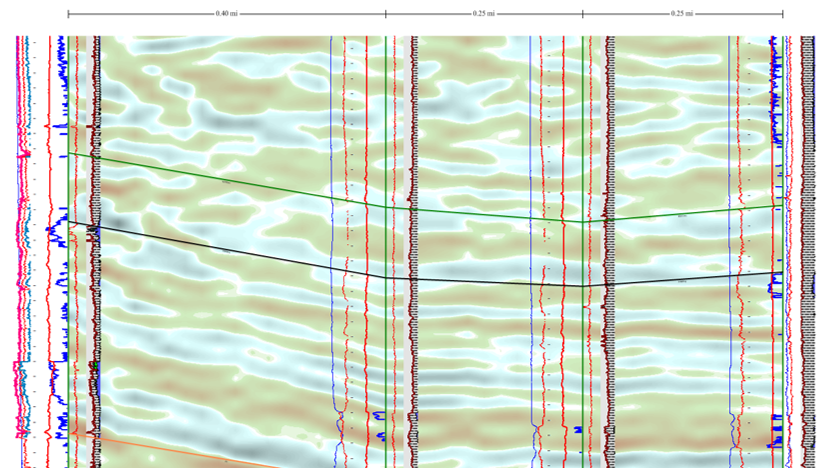
- Open GVERSE Geophysics and display the GVERSE Petrophysics template in a seismic interpretation.
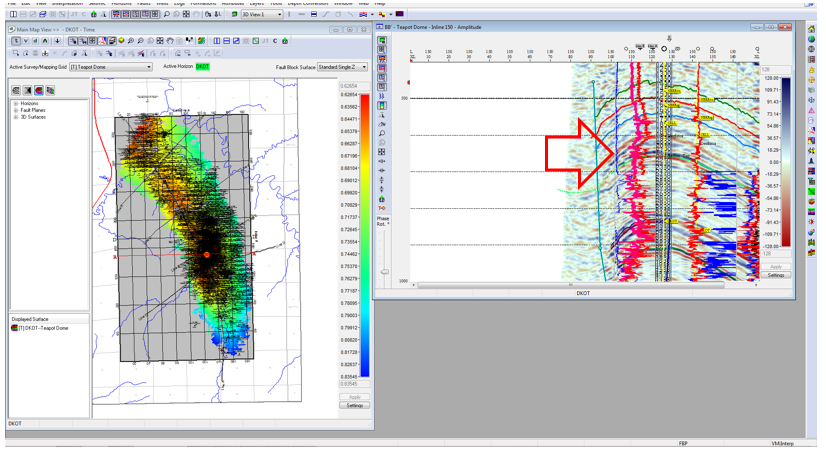
- The template can be displayed in an Inline, Crossline, Arbitrary line etc. in the seismic interpretation.
