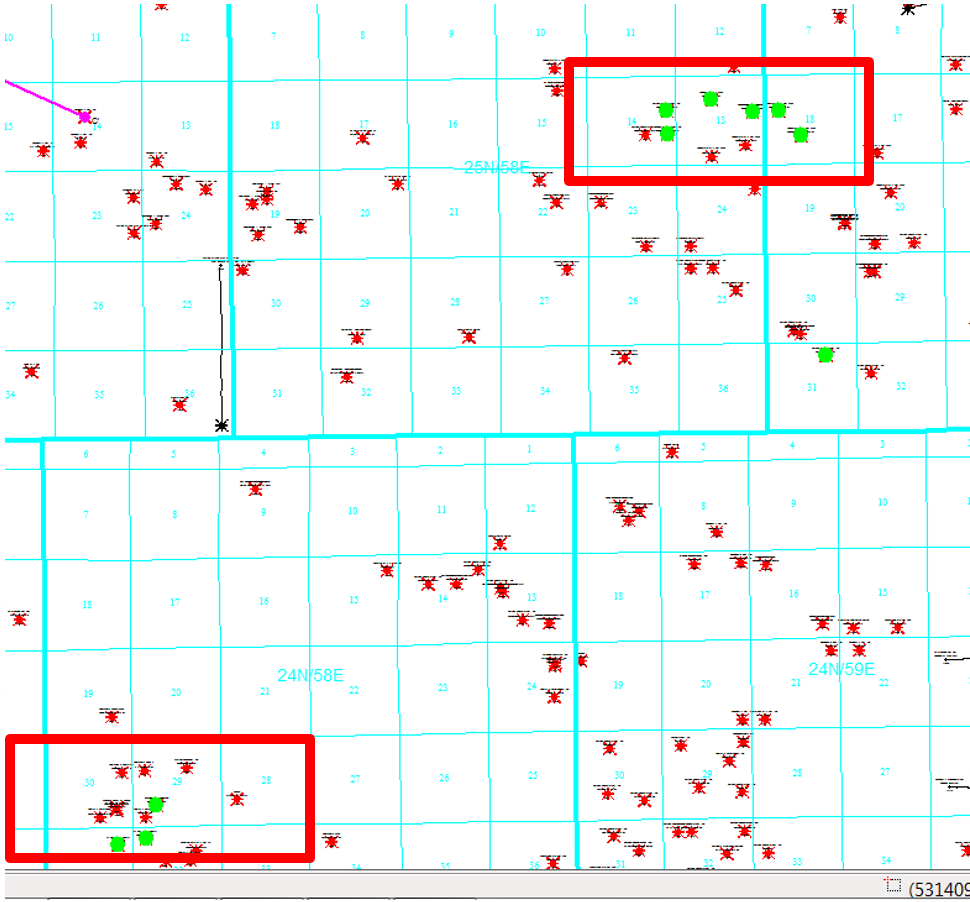
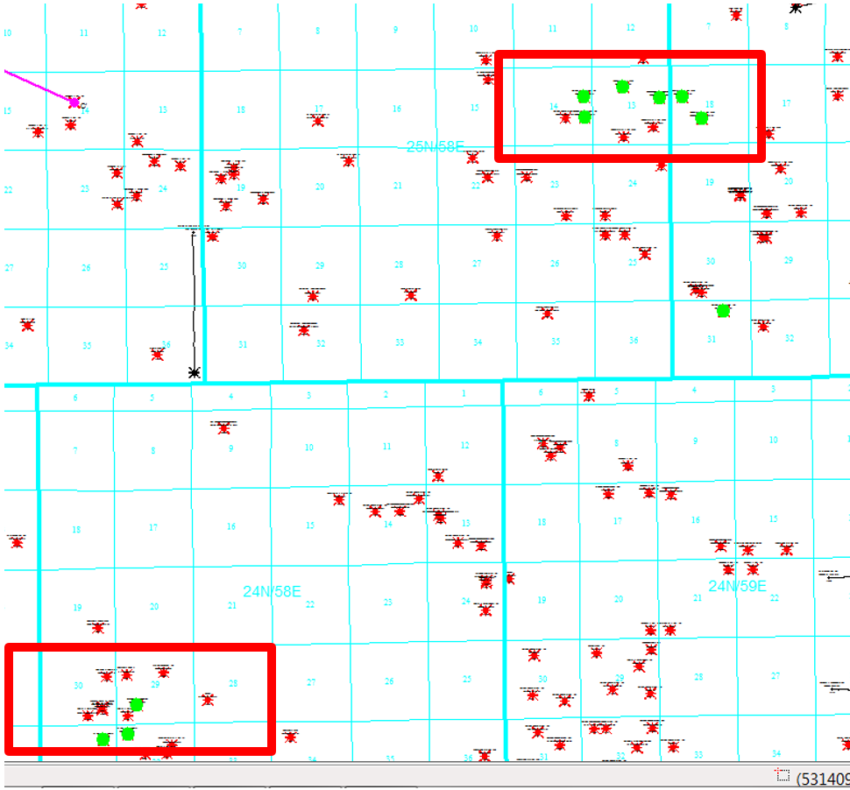
While working with a map, the interpreter sometimes needs to measure the distance or angle between point A and point B using a specific unit. They may also need to change the color of the highlighted area on the map or track the cursor’s position while moving across a cross-section. GeoAtlas provides various options that allow the interpreter to customize measurement units, highlight colors, and more. This blog will provide a step-by-step guide on how to change the status bar panels and display colors in a GeoAtlas map.
- Activate a project in GeoGraphix and click on the GeoAtlas icon in the toolbar.


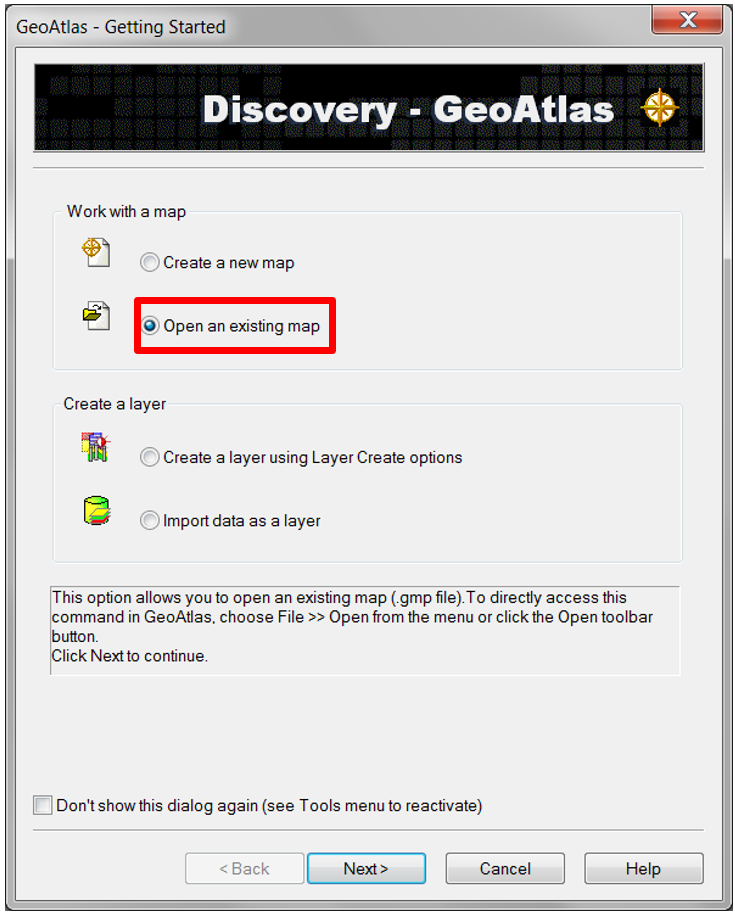
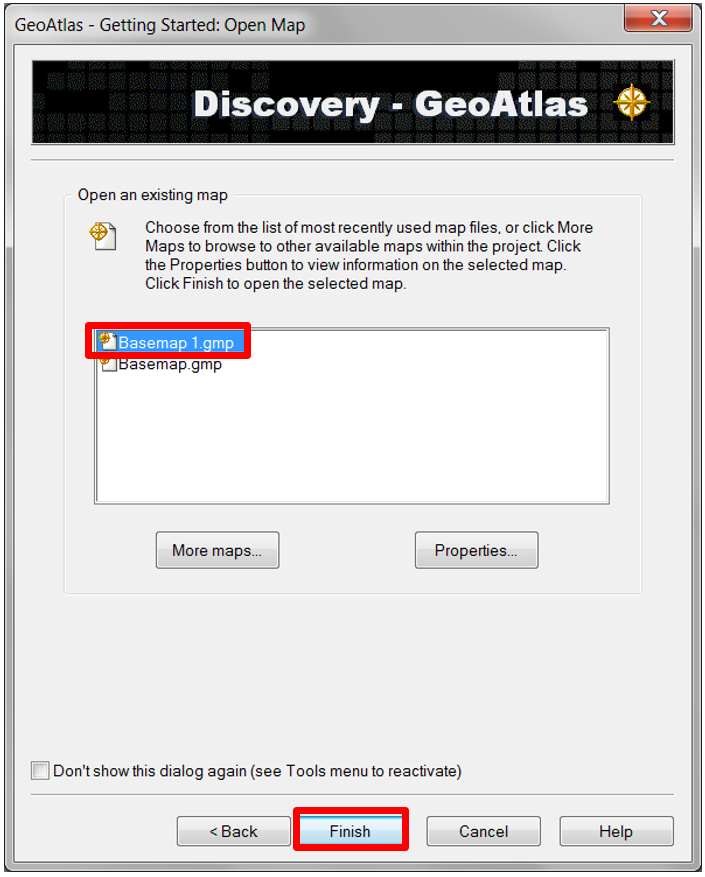
- GeoAtlas will open. Select Create a New Map or Open an Existing Map. In case of the latter, select the map and click Finish.
- The GeoAtlas Map will open, displaying all the layers saved on the map.
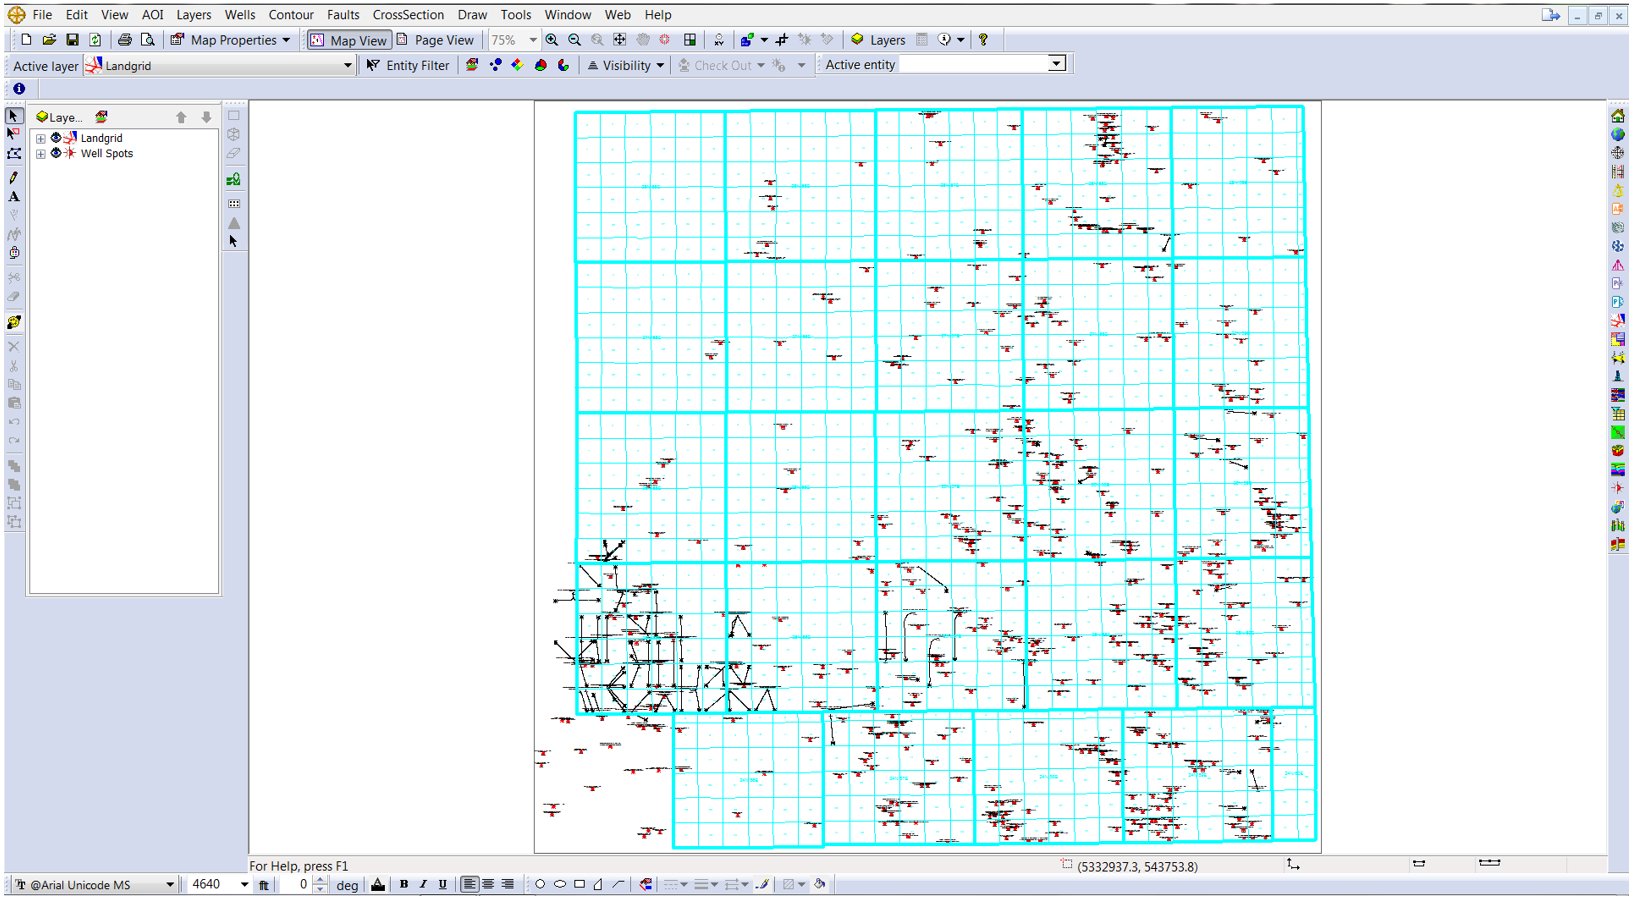
- In GeoAtlas, go to Tools and select Options.

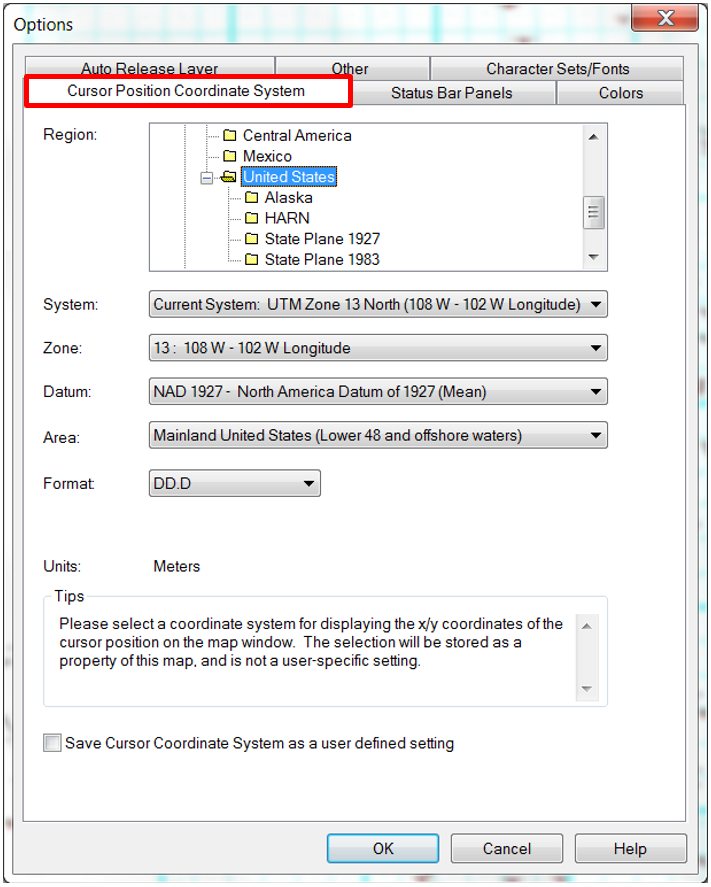
- Choose Cursor Position Coordinate System in options to display the map coordinates of the cursor position on the status bar, allowing you to modify the map coordinate system.

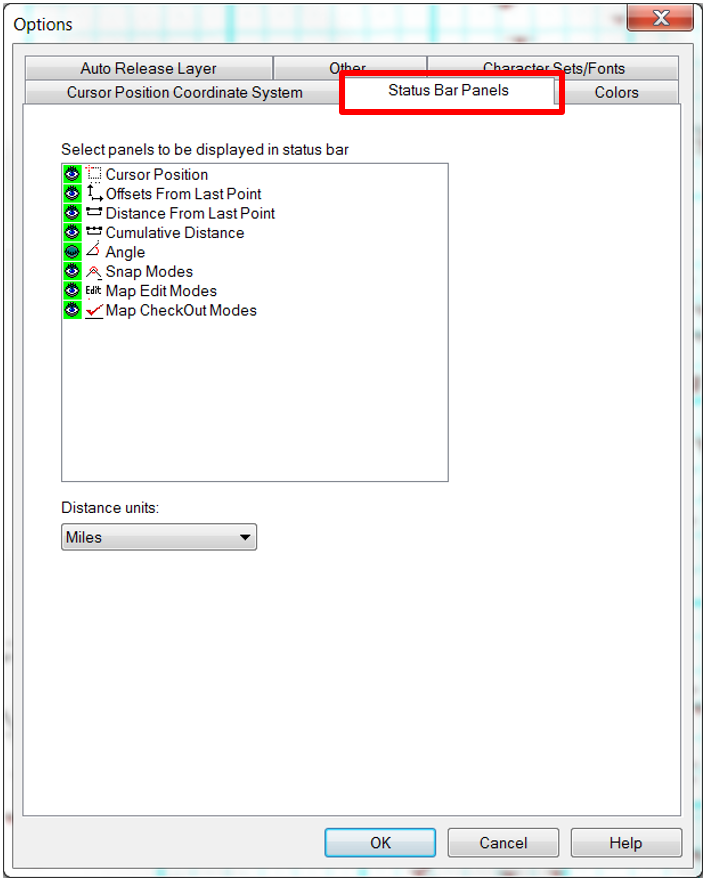
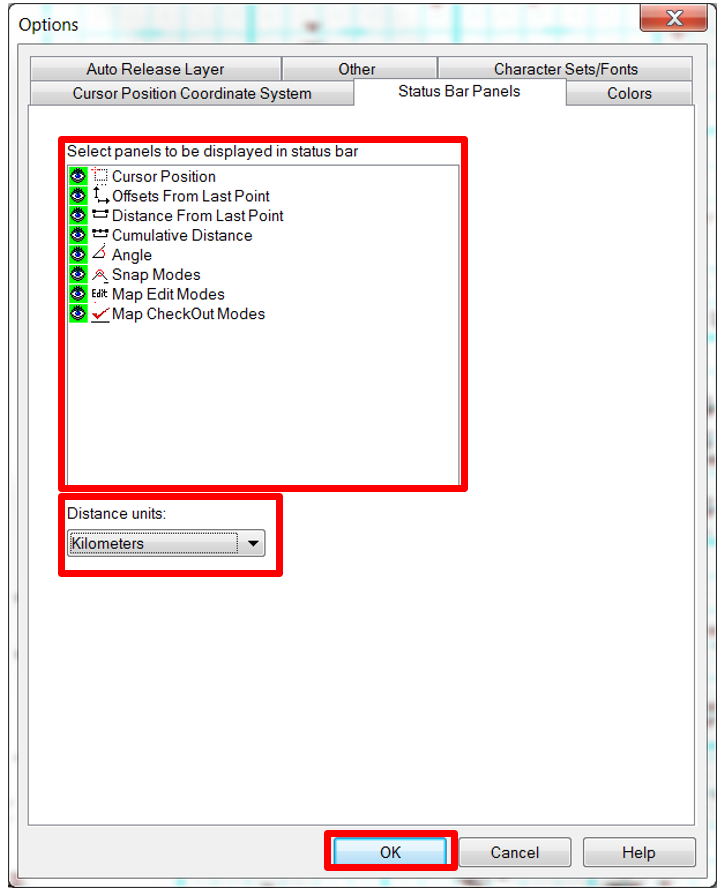
- Click Status Bar Panels in the Options window.
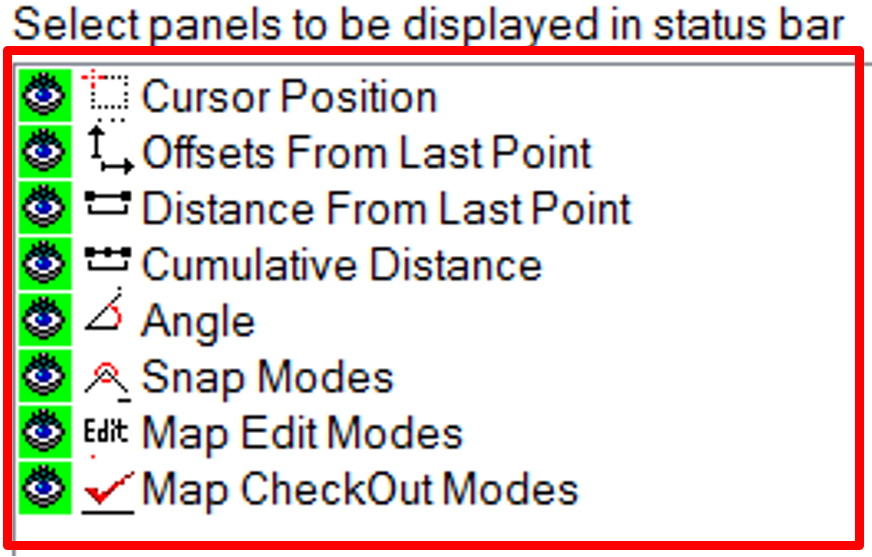
- In the Select panels to be displayed in status bar box, turn the panels to be displayed in GeoAtlas ON or OFF.
- Under Distance Units, select the unit to be used to display the panels on the status bar window. The list of units displays sixty-seven different options.
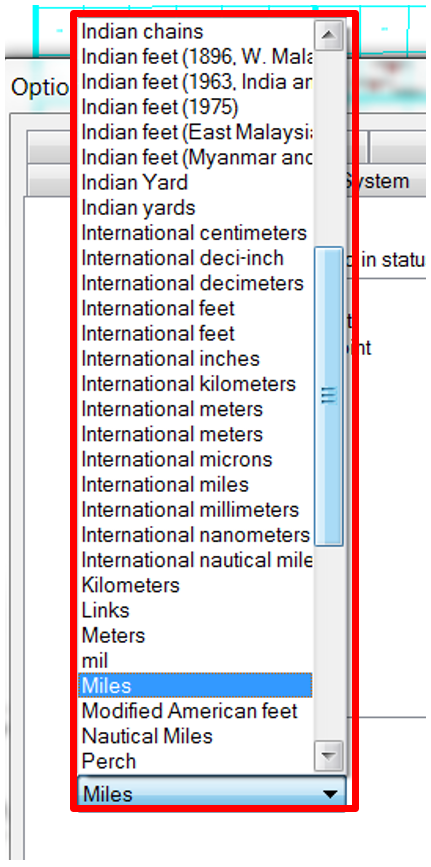
- After selecting the unit and the information to be displayed on the status bar, click OK.
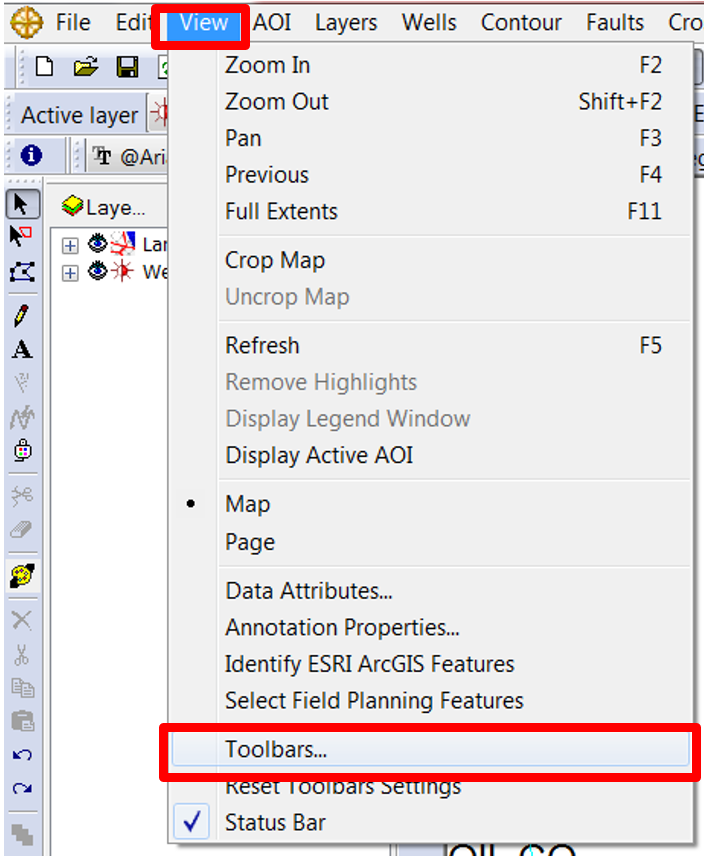
- In GeoAtlas, go to View and select Toolbars.
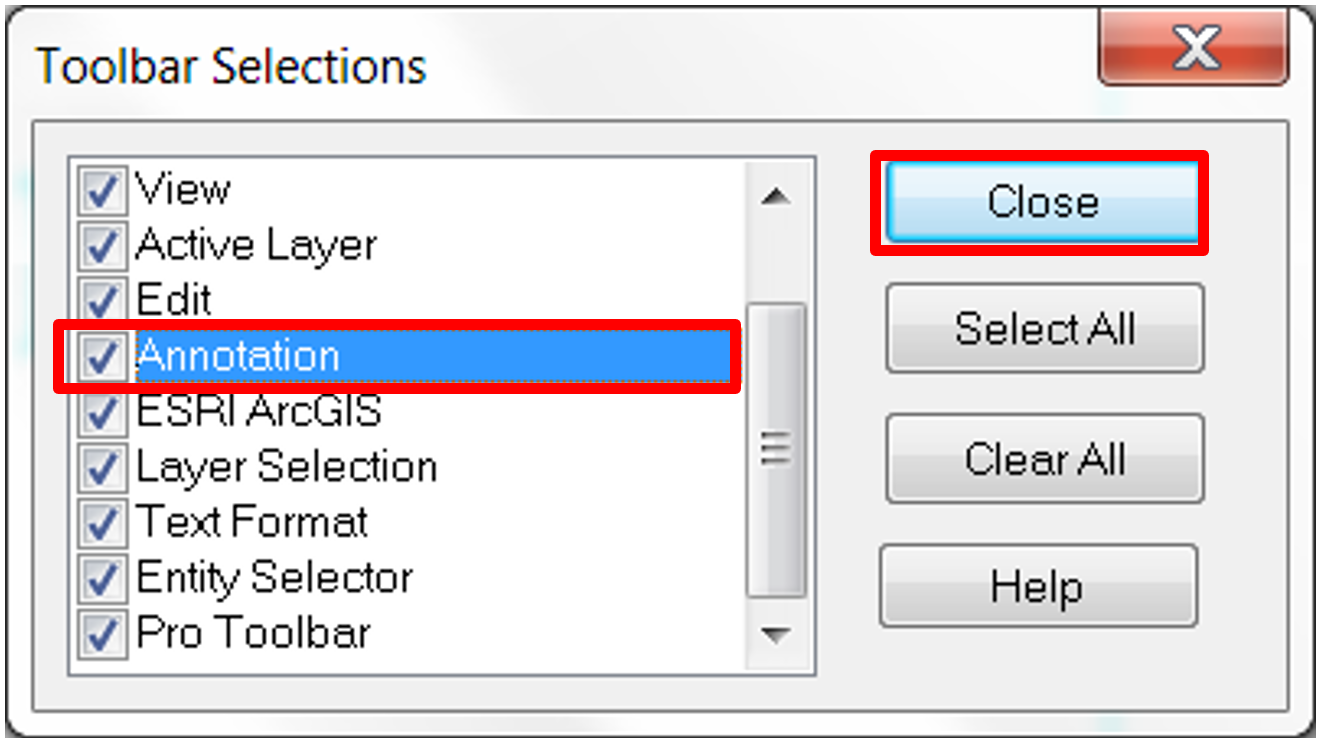
- The Toolbar Selections window will open. If the Annotation box is not selected, select it and click Close.
- The Annotation toolbar will appear on the map view. Click the Line Tool.

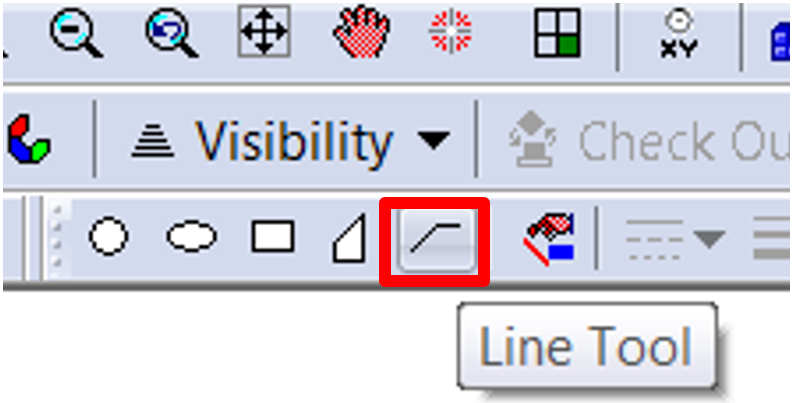
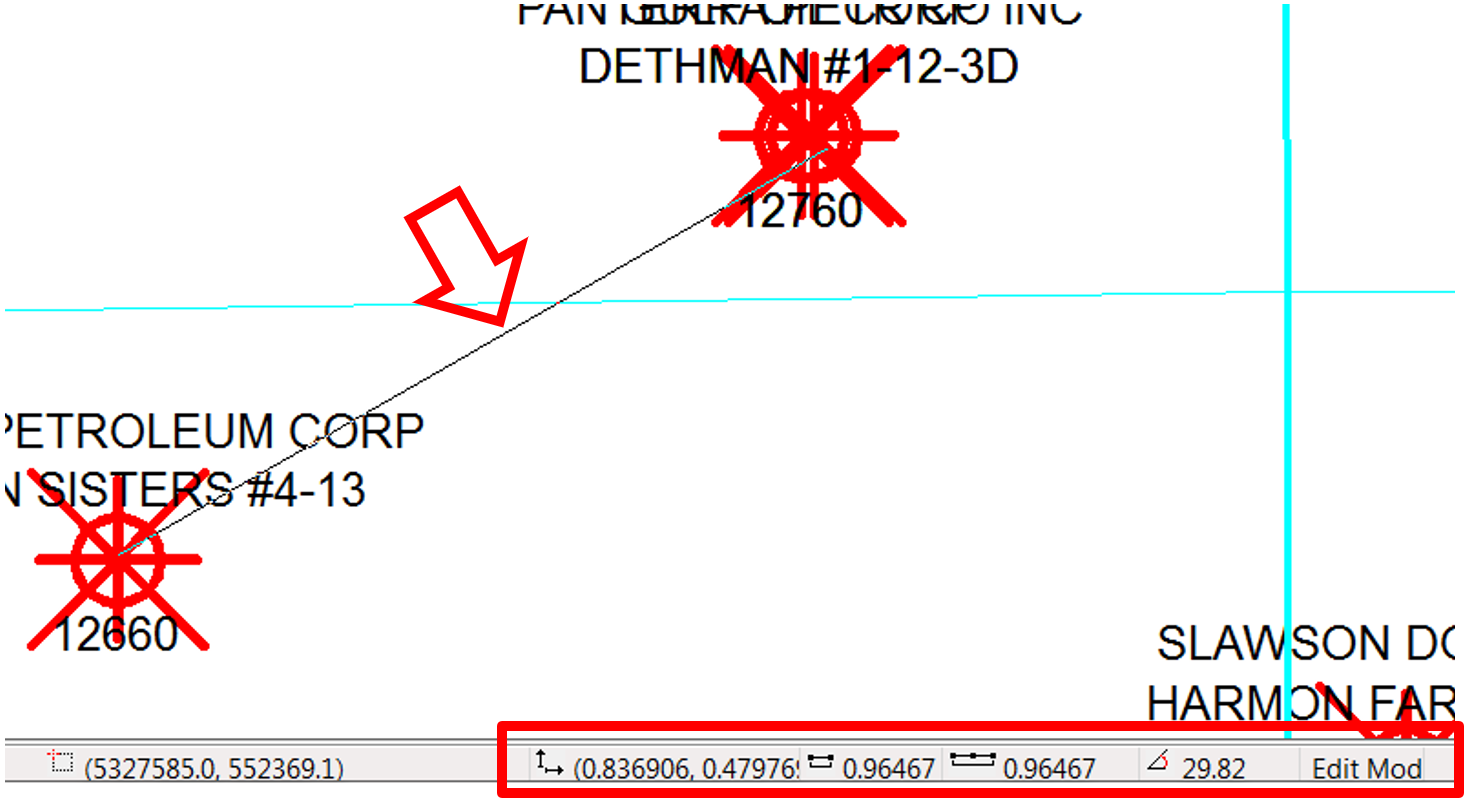
- The mouse cursor will change to a pencil. Left-click to create the first point and click as many times as necessary on the map. A line will appear, and the values will be displayed on the status bar.
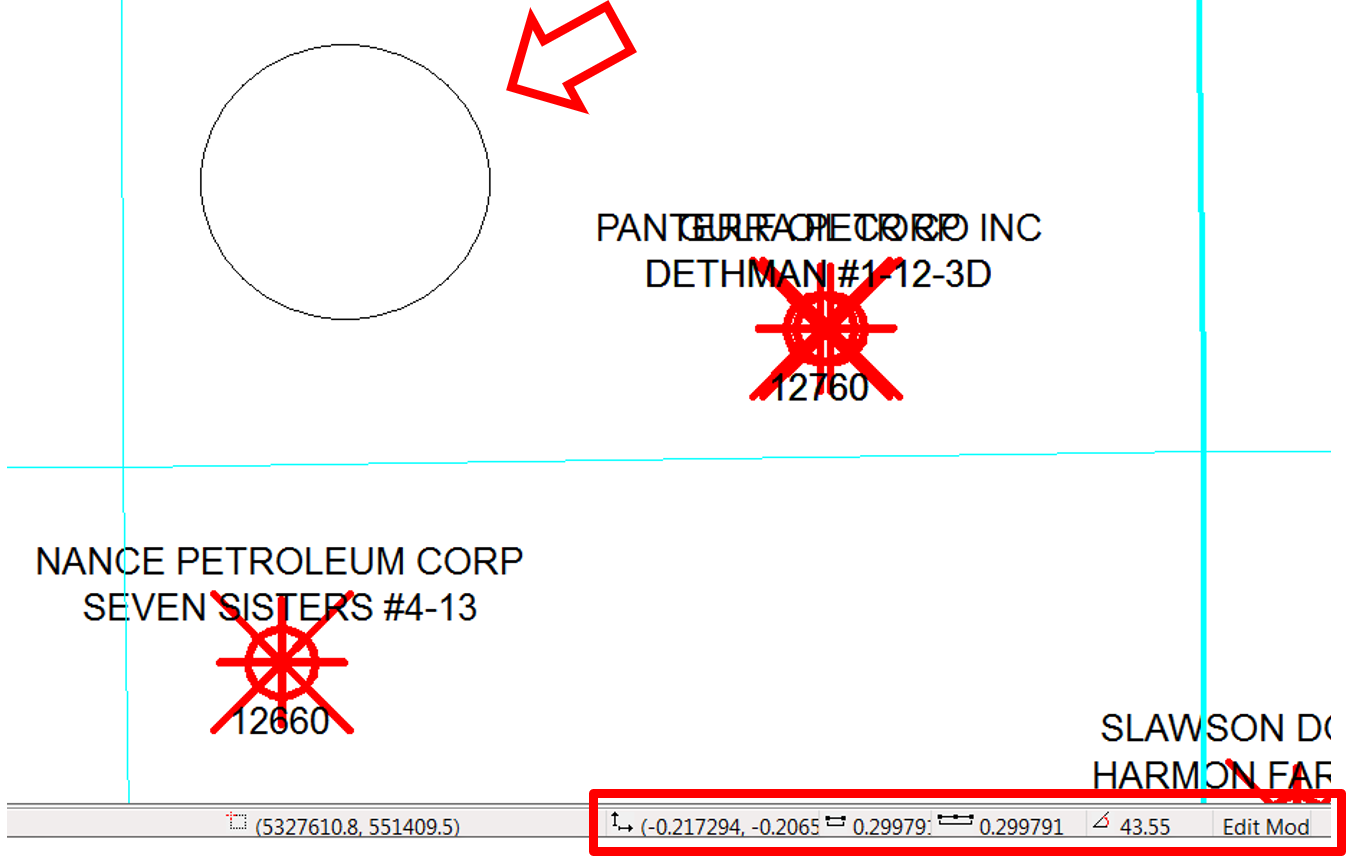
- If a circle, square, ellipsoid, etc. is drawn on the map, the values will also appear on the status bar.
- In GeoAtlas, go to Tools and select Options again.

- The Options window will open. Click on the Colors tab.
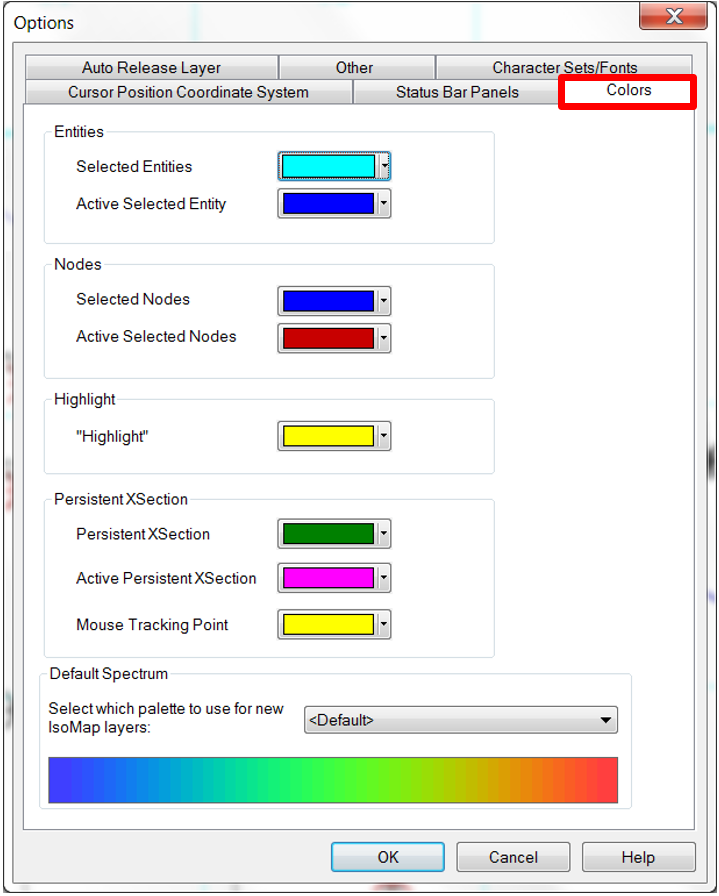
- The Default Spectrum palette for IsoMap layers can be changed here.
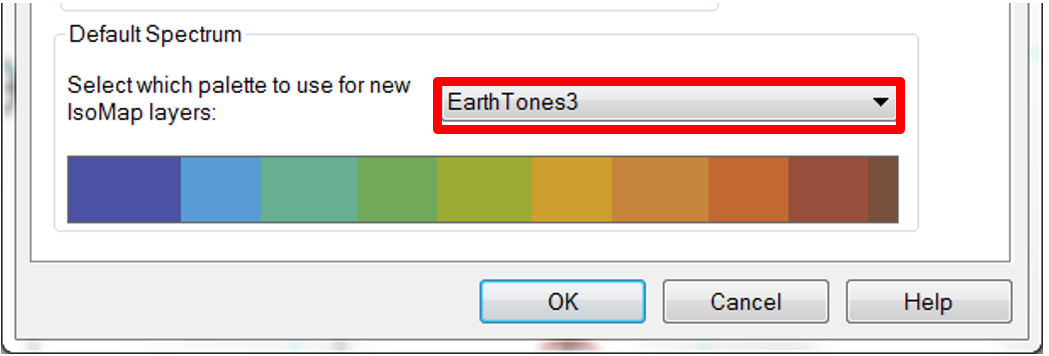
- Under Highlight, you can change the color when a well is selected in WellBase and highlighted in GeoAtlas. On Persistent XSection, change the Mouse Tracking Point color, apply any additional changes and click OK.
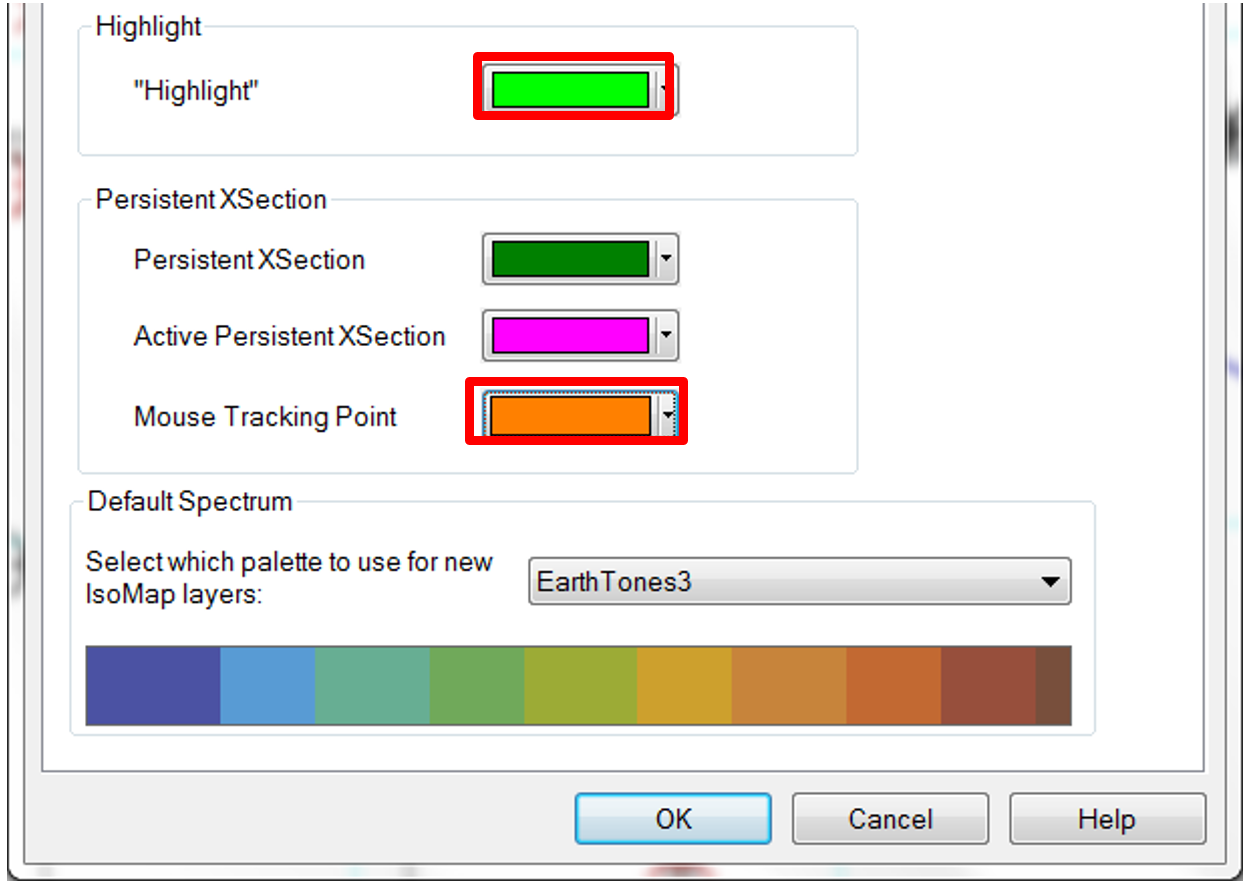
- Open a cross-section in XSection and move the mouse within the cross section. The tracking point will display the new color.

- Open WellBase, select a well or wells, and click on View Well(s) In – > Send Wells to GeoAtlas.
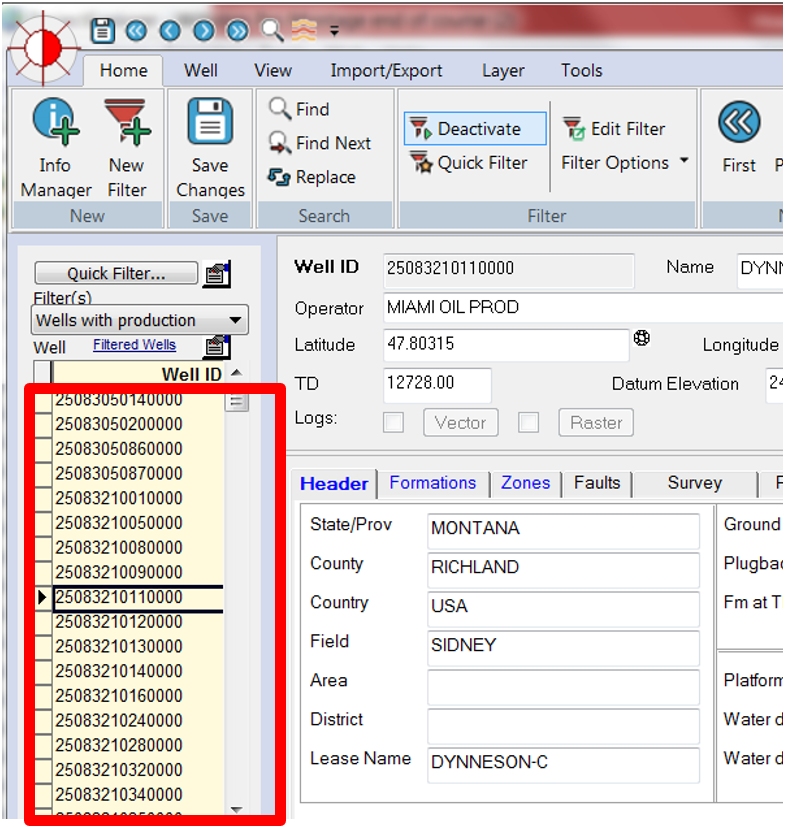
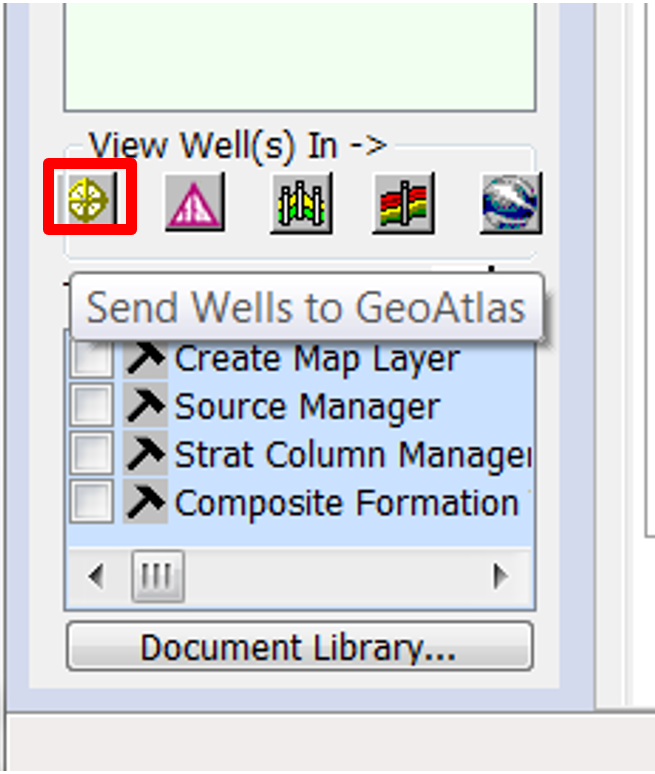
- The well(s) will be highlighted on the map.
