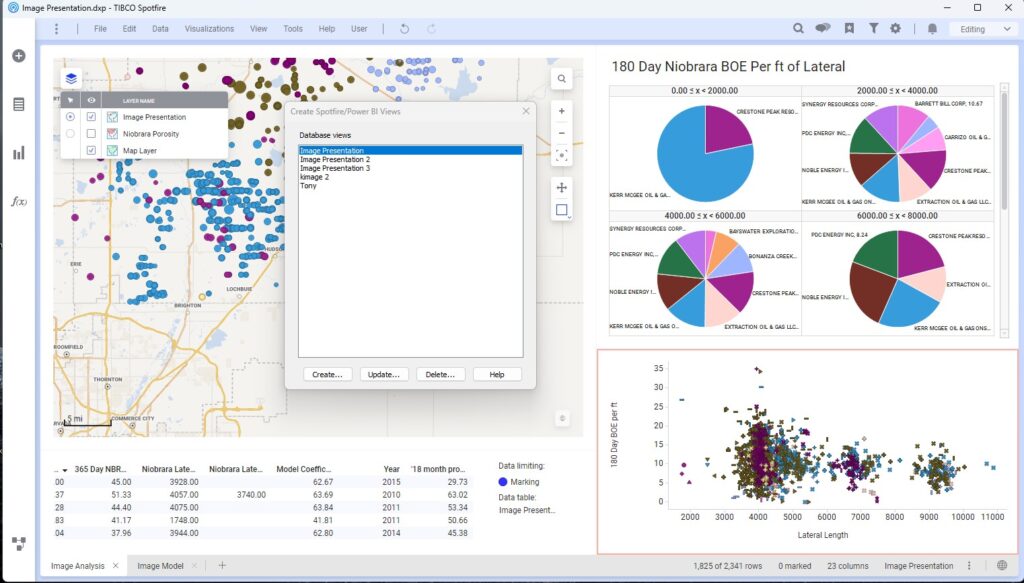
Spotfire, with its ability to perform complex multi-variate analyses, has become the analytics tool of choice to understand what drives hydrocarbon production in the subsurface. But every customer and basin are different, and what works in one set of circumstances won’t work in another.
Unlike some of our competitors, our goal isn’t to do the analysis for you. Our goal is to make the data stored in GVERSE GeoGraphix accessible so you can perform the analysis that makes sense for you. GVERSE GeoGraphix utilizes a powerful relational database for data storage, so it’s always been possible to access GeoGraphix data in Spotfire and Power BI, but doing so required an understanding of the underlying GeoGraphix data model. Not an easy task. The trick is to get GGX data into Spotfire in a form that Spotfire understands, and what Spotfire understands is spreadsheets.
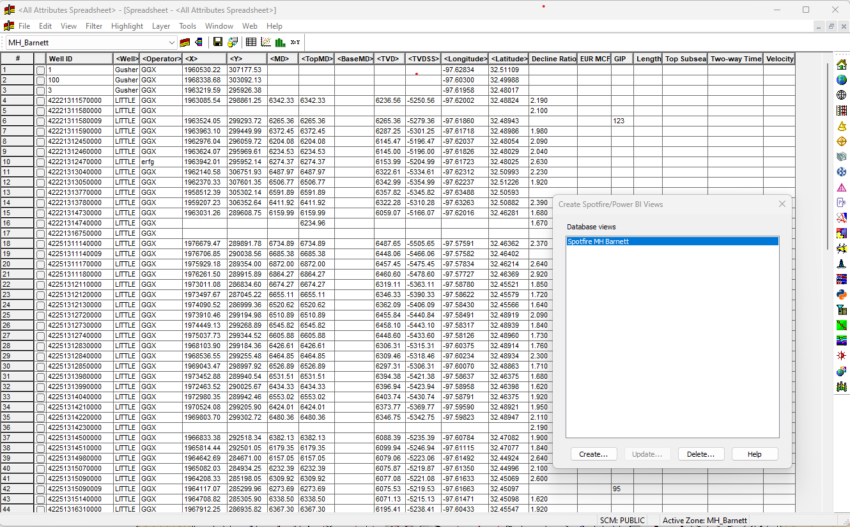
In our latest release, we solved the problem with a single button click from ZoneManager. You can think of ZoneManager as a Swiss-army knife for viewing and editing subsurface data in a spreadsheet format. It’s the integration point where attribute data calculated from GeoGraphix map grids, user-defined petrophysical equations, and variables such as well lateral length and Gas/Oil/BOE per foot of lateral are stored.

We’ve added a new feature in 2023.1 that lets you create a database view from a ZoneManager spreadsheet and have the spreadsheet instantly accessible in Spotfire. And even better, because the database view is live on your GeoGraphix data, when you add or edit data in GeoGraphix, Spotfire loads the updated data seamlessly. In GeoGraphix 2023.1, we’ve taken the complexity out of using GGX data in your analytics software. GVERSE GeoGraphix and Well Analytics – A Perfect Match.


