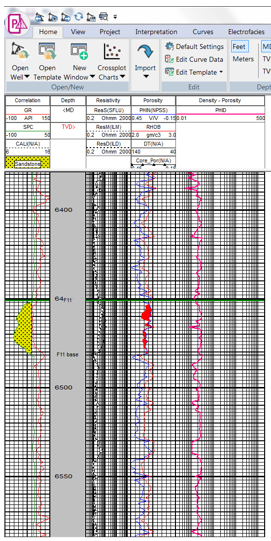
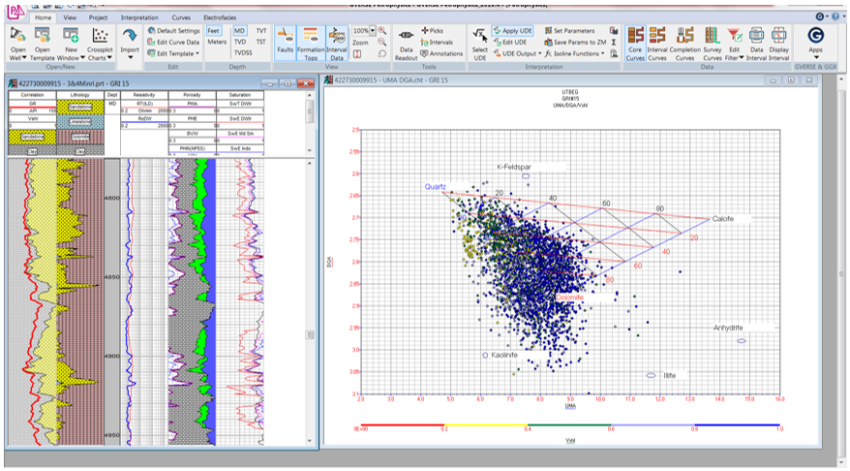
GVERSE GeoGraphix modules have a very close interaction between them, helping the interpreters to visualize and use data or interpretation from one module to another with just a few clicks. In GVERSE Petrophysics, the interpreter can create, edit, or personalize petrophysical equations using the User Defined Equation (UDE) or the Petrophysics External Model (PEM) tools. The UDE will allow users to edit (preload equations) or create petrophysical equations directly in GVERSE Petrophysics. This blog explains step-by-step how to calculate density using a petrophysical equation:
- Activate a GVERSE GeoGraphix project and click on the GVERSE Petrophysics icon on the modules toolbar.
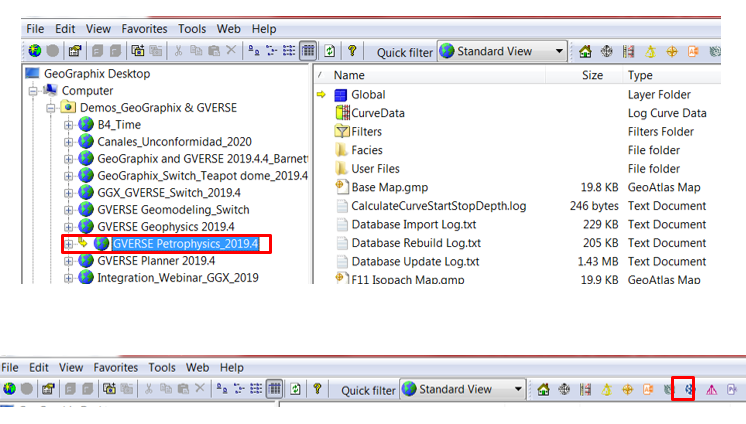
- GVERSE Petrophysics is open. The Open Session window opens if a session was saved; otherwise, the well list with curve data appears. Select the well, then click Open. Select the session and click OK.

- GVERSE Petrophysics interpretation is open.
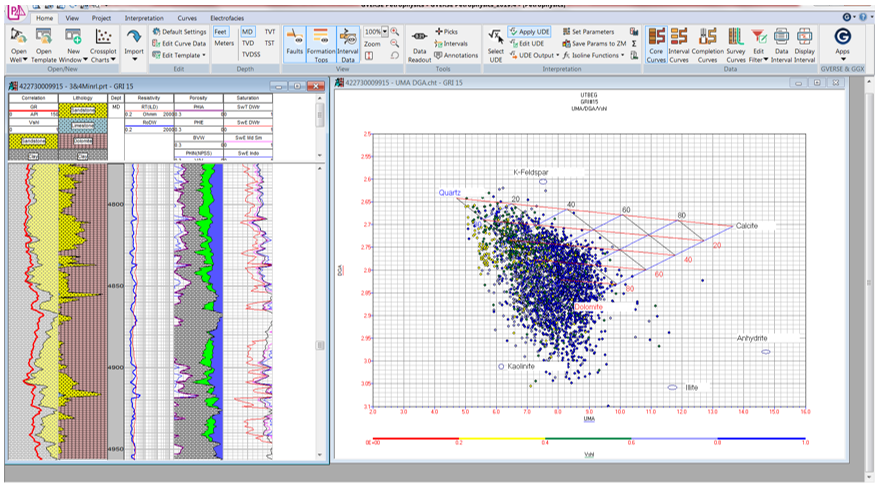
- To create a UDE (User Defined Equation) to calculate density, go to the Interpretation tab and click on Select User Defined Equation Set, it will open in a new window.
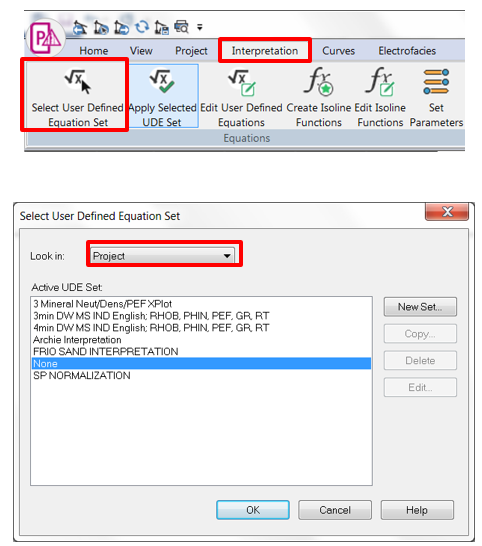
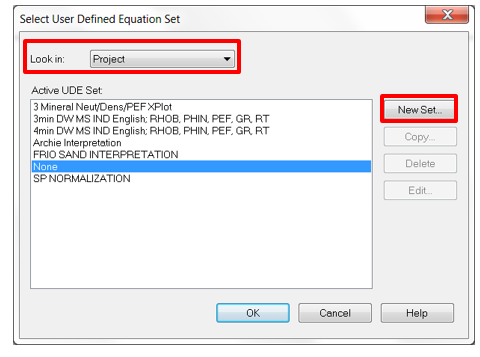
- Under Look in: two options appear: project and system. Project will store all the UDEs created in the project; and system all the UDEs pre-created by GeoGraphix. Select Project, and then click on New Set.
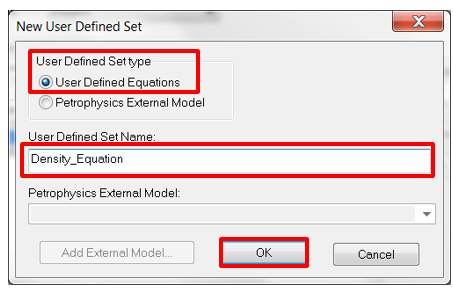
- The New User Defined Set window opens. Select User Defined Equations, add a name for the new equation under User Defined Set Name and click OK.
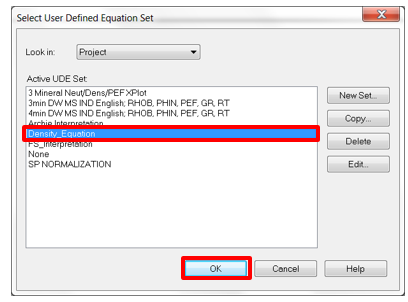
- Make sure the new equation is selected and click OK.
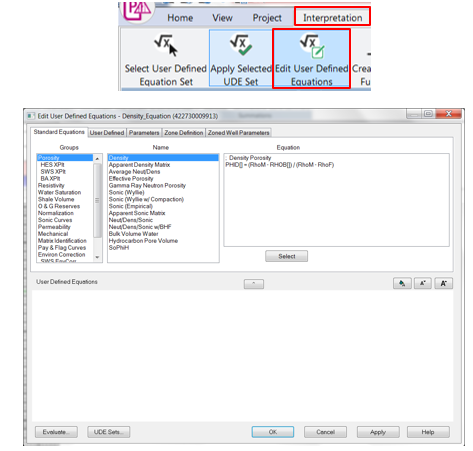
- In the Interpretation tab, click Edit User-Defined Equations to open its window.
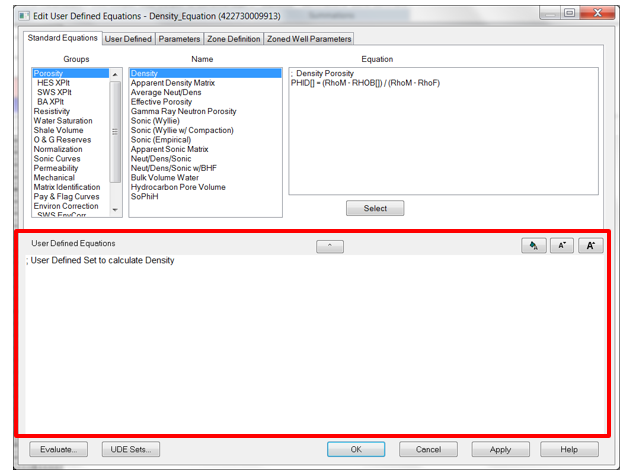
- In the User Defined Equations box type User Defined Set to Calculate Density in the first line.
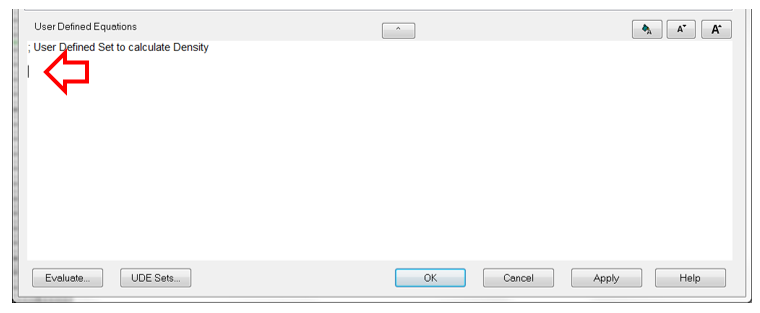
- Move the cursor to the end of the equation title and press Enter on the keyboard to add a blank line.
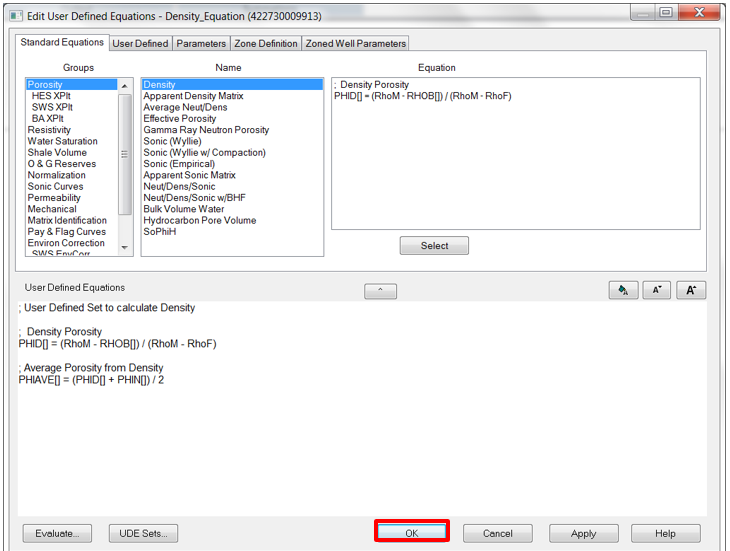
- In the Groups select Porosity, in Name select Density, and in Equation the density porosity equation will appear.
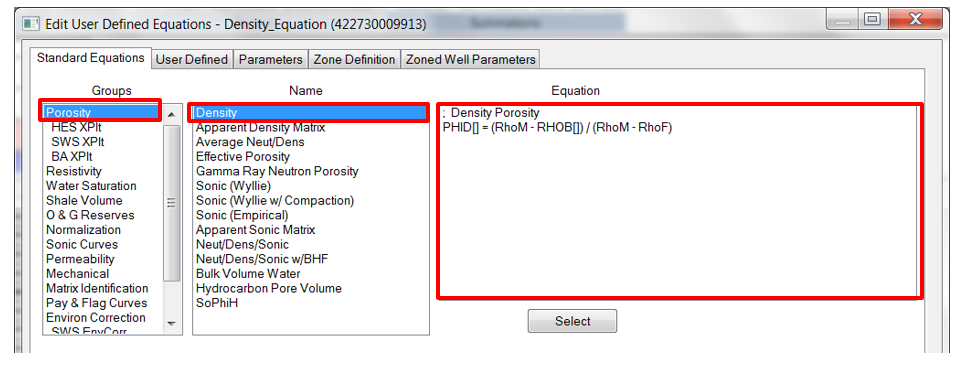
- Click Select to add the density-porosity equation to the User Defined Equations box.
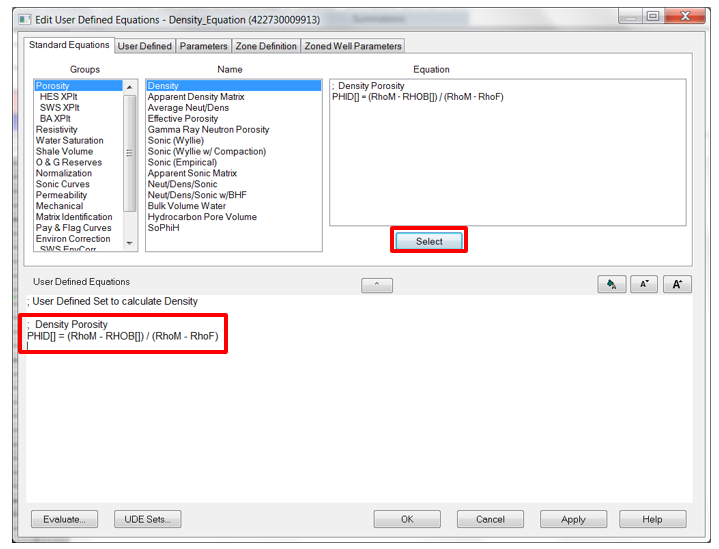
- Move the cursor to the end of the density-porosity equation, press Enter and type Average Porosity from Density.
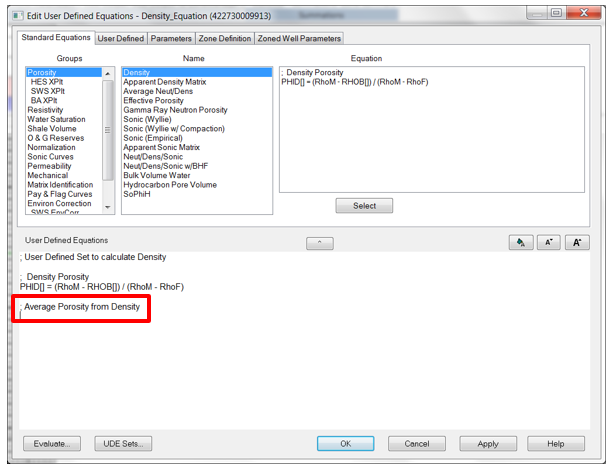
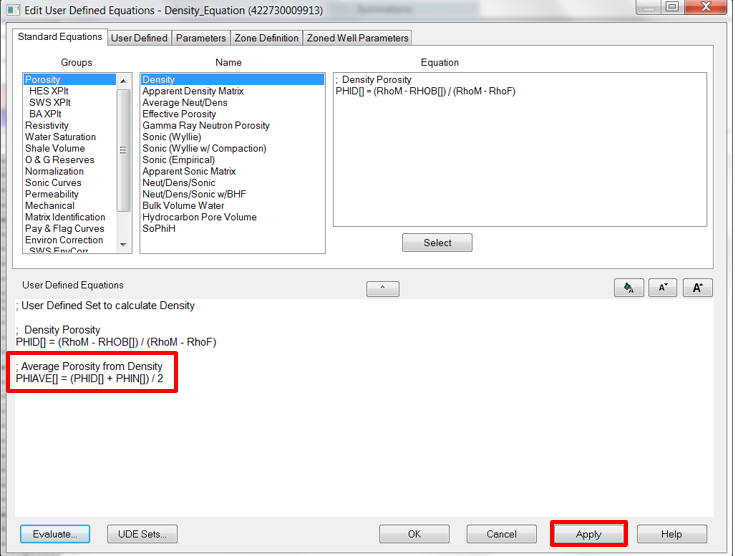
- Move the cursor to the end of Average Porosity from Density, press Enter and type the following equation: PHIAVE[] = (PHID[] + PHIN[]) / 2. Click Apply.
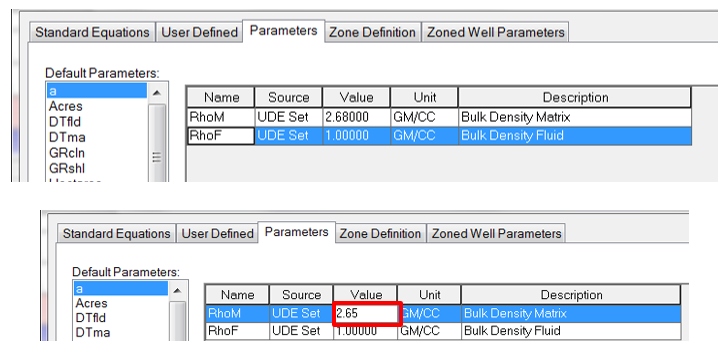
- Go to the Parameters tab. For the RhoM value, type: 2.65 (sandstone matrix density).
- On the Edit User-Defined Equations window, click OK.
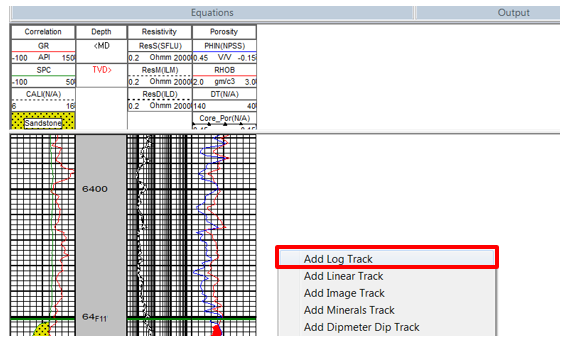
- To display the new curve (PHID – Density Porosity) on the template right click on the white part and select Add Log Track.
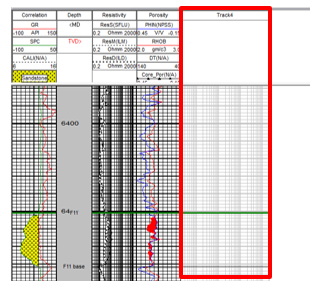
- A new track appears.
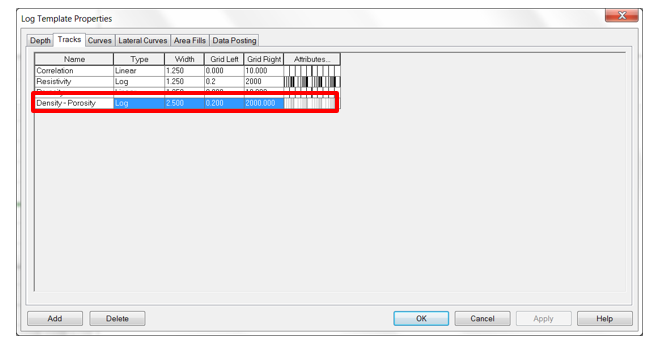
- Double click on top of the new track to open the Log Template Properties window. Look for the new track and under Name change the track name and click Apply.
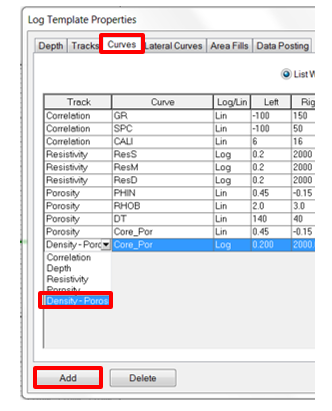
- Go to Curves tab, click Add, and select the new track from the list of tracks.
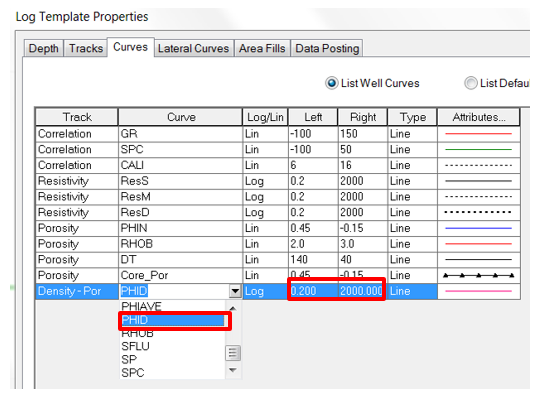
- In the Curves column, select PHID from the list of curves to be displayed on the new track. In the Attributes column, click the box to change the curve display and select the scale for the left and right. After applying all the changes click OK.
- The new curve will appear on the new track.
