Interval attributes can be generated along the wellbore path from the IsoMap layers to display interval attributes as curves in various GVERSE GeoGraphix applications. The interpreter can view all interval and related data in the Intervals tab in WellBase. Also, users have the flexibility to create custom data fields for interval types, create and post interval curves from data fields on cross sections and templates, and add color-coded wells in GeoAtlas. This blog will explain step-by-step how to create and use interval curves in GeoAtlas, WellBase, GVERSE Petrophysics, and GVERSE Geo:
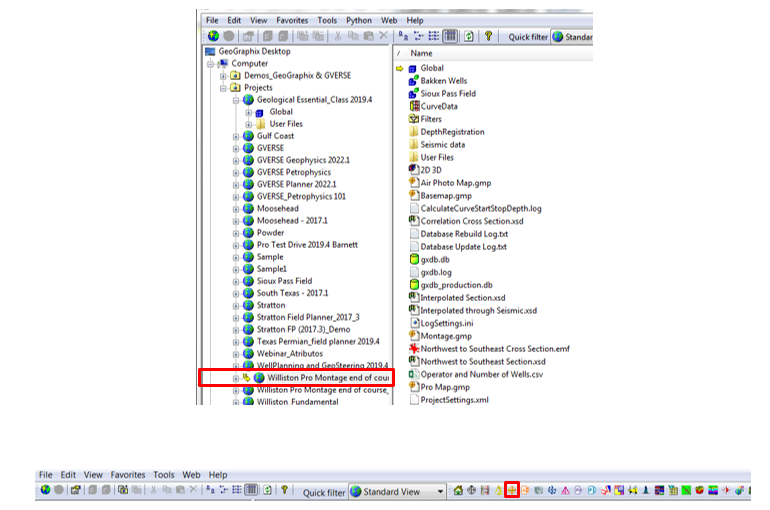
- Activate a project in GVERSE GeoGraphix and click on the GeoAtlas icon on the modules toolbar.
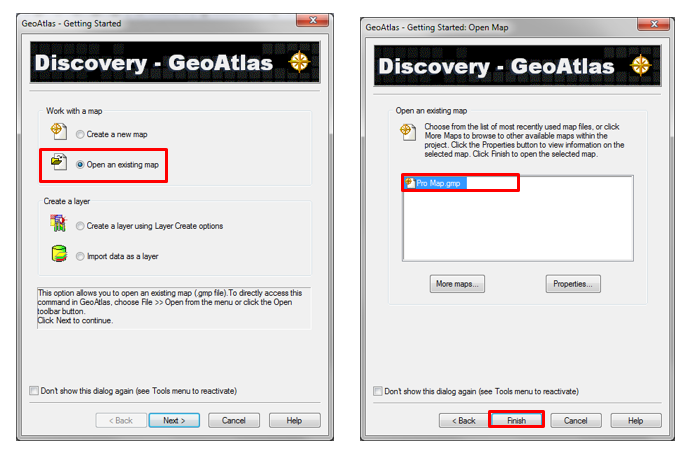
- The GeoAtlas – Getting Started window will open. Select Create a new map or Open an existing map and click Next. If you select Open an existing map the GeoAtlas – Getting Started Open Map window will appear where you can select the map from the list and click Finish.
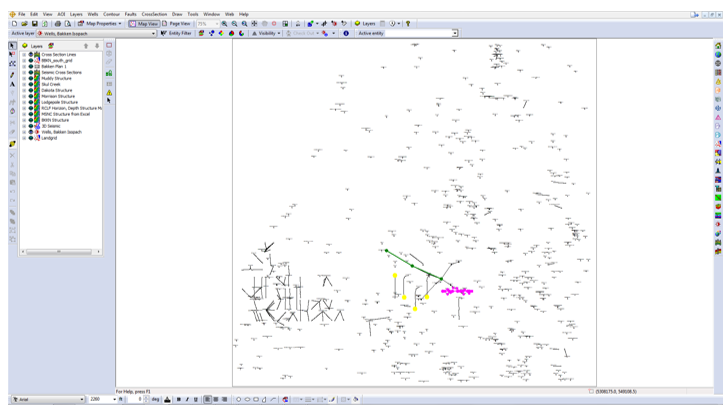
- GeoAtlas will open displaying all the layers in the map.
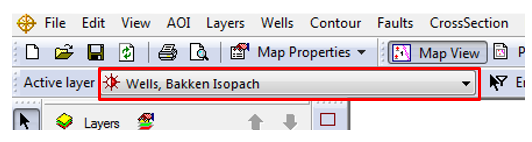
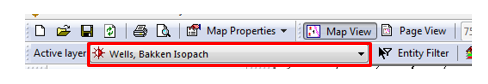
- Turn off any unnecessary layers from the map. Go to the Active layer drop menu and select a WellBase layer to activate it.
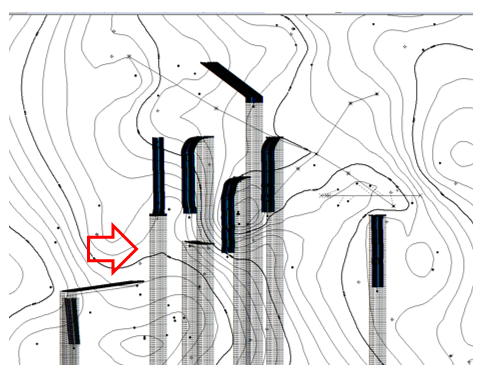
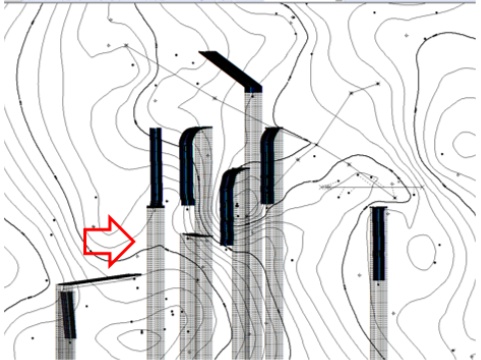
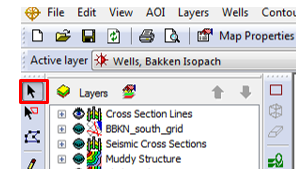
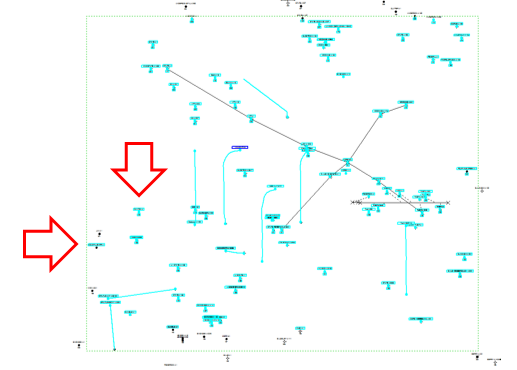
- Activate the selection tool (black arrow) to select the wells that are to be used.
- Left-click and select the wells to be used to calculate the interval. A box will appear showing the selected wells area.
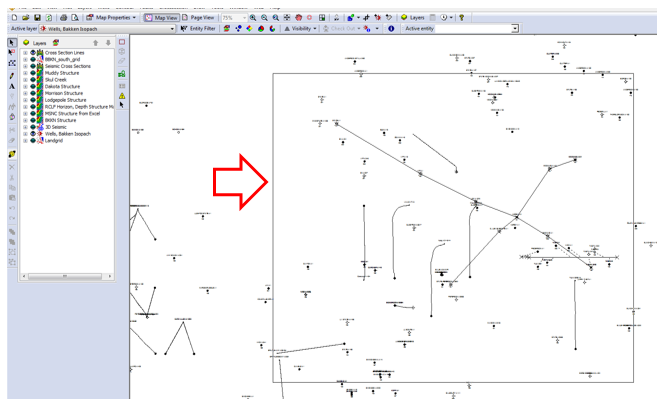
- The selected wells will turn blue.
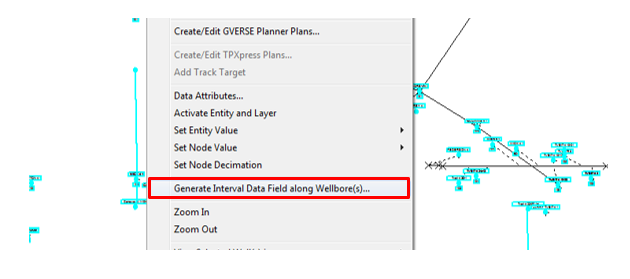
- On the selected (blue) wells right-click and select Generate Interval Data Field along Wellbore(s).
- The Generate Interval Data Field along Wellbore(s) window will open.
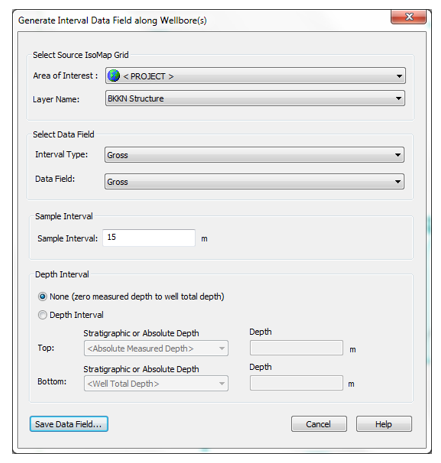
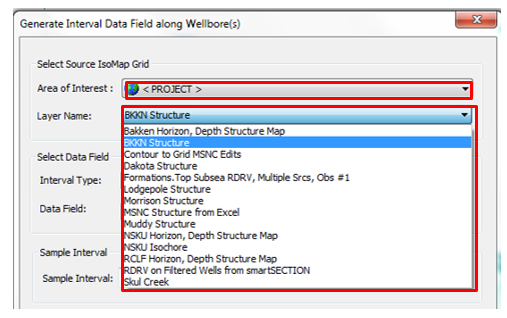
- Under Select Source IsoMap Grid select the Area of Interest, and Layer Name from the list of active layers.
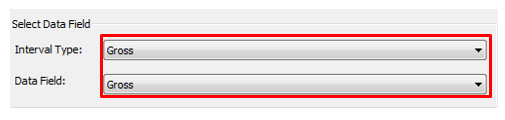
- In Select Data Field select the Interval Type and Data Field.
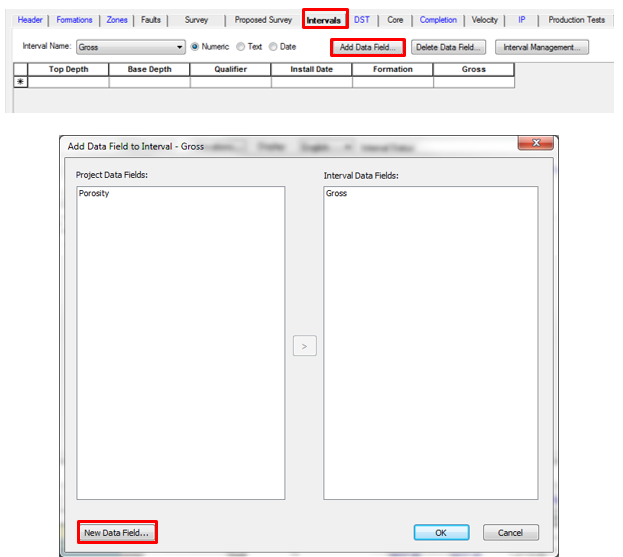
- The interval type and the data field have to be created first in order to appear on the drop menus. Open WellBase and go to the Intervals tab. Select Add Data Field to open the Add Data Field to Interval window and click New Data Field.
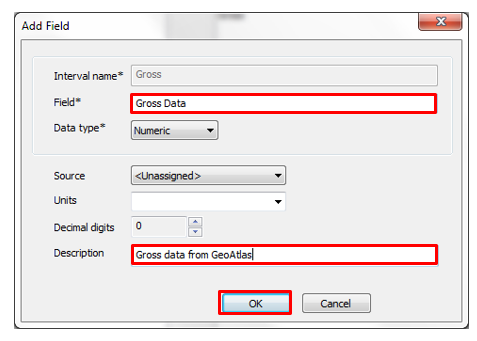
- The Add Field window will open. Under Field* type a name for the field, select the data type, source, units and description and click OK.
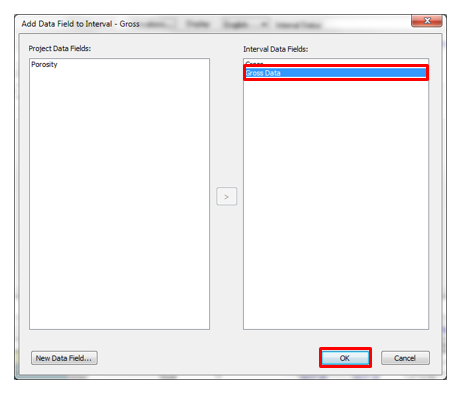
- The new data field will appear under Interval Data Fields. Click OK.
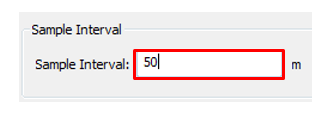
- Under Sample Interval select the sample interval (meters or feet based on the map projection system).
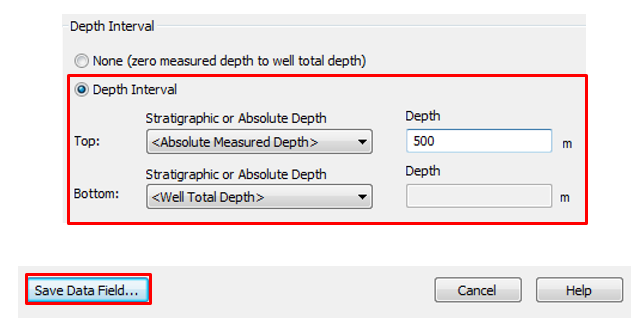
- In Depth Interval you can select the entire wellbore or select the calculation range. Click Save Data Field.
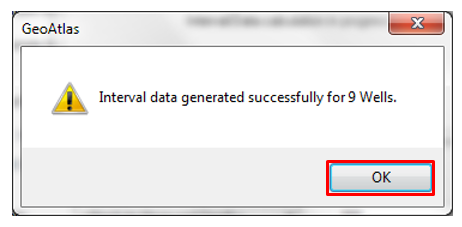
- Wait for the process to finish. A GeoAtlas prompt will appear showing the amount of wells where the interval data was calculated/generated.
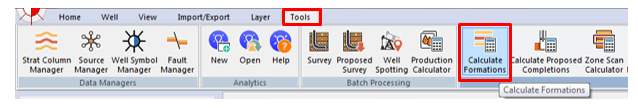
- Go back to WellBase and select Calculate Formations in the Tools tab.
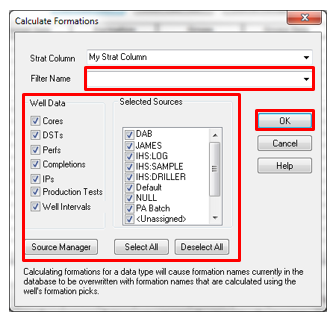
- The Calculation Formations window will open. Select the parameters and apply a filter if necessary (for a large database using a filter is advised) and click OK.
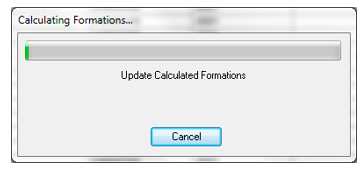
- Wait for the process to finish.
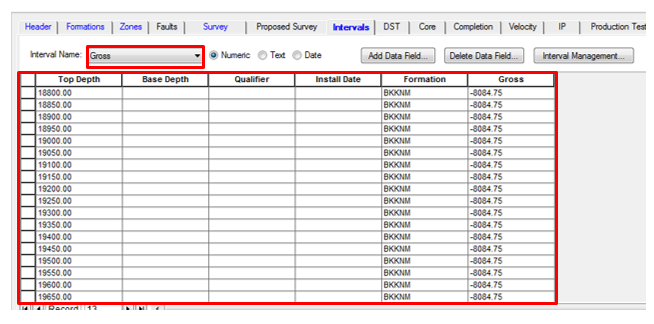
- In WellBase go to the Intervals tab and select the Interval Name (Gross for this example). Top Depth is based on the sample interval. The Gross data column will display the calculated values based on the IsoMap layer grid used in GeoAtlas.
- The can be posted in the WellBase GeoAtlas layer, make sure the WellBase layer is active in GeoAtlas.
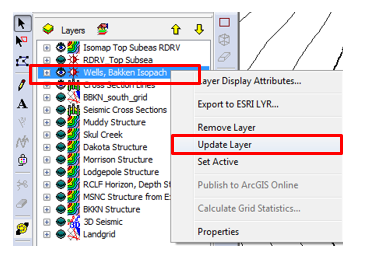
- In Layers highlight the selected layer, right-click and select Update Layer. Or right-click and select Update Active Layer on the map.
- The WellBase layer update window will open. Expand the tree under Interval Data.
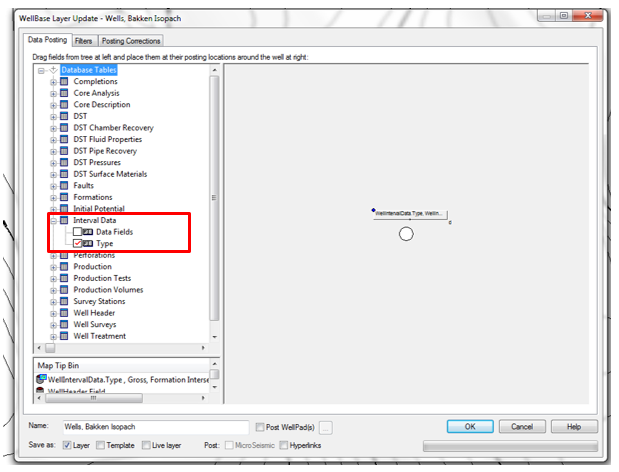
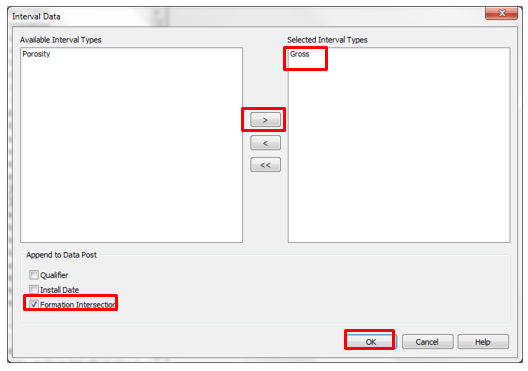
- Drag type to the next window next to the well. The Interval Data window will open. Select the type from the Available Interval Types and click the single arrow (>) to move the type to the Selected Interval Types box. Check mark Formation Intersection and click OK.
- The type interval information will display on the map.