
ZoneManager is a module for storage, display, and analysis of well data on a zone basis. You can define multiple zones and a large number of associated attributes for each zone, as well as input attribute data for each well in the project. The Interpolated Tops tool in ZoneManager will display the intersection of an IsoMap surface with wells in a selected filtered list associated with ZoneManager zones.
Here’s how to interpolate tops in ZoneManager:
- Activate a project in GeoGraphix and open the ZoneManager module.

- Open or create a new ZoneManager interpretation.

- The attributes zones window will appear, displaying all the attributes created for this specific zone.

- In ZoneManager go to File > Import > Create Interpolate Tops.

- In the Create Interpolate Tops window select Area of Interest and IsoMap gridded surface layer to be used as a data source, apply offset if needed, and then select the formation name and source (WellBase filter and the Strat Column Manager can also be selected if needed). Click OK.

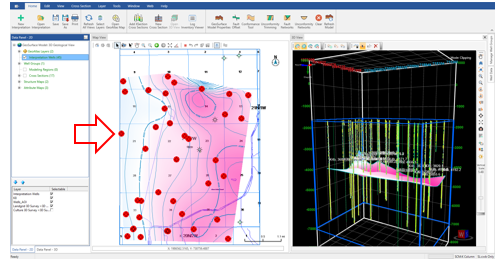
- The new picks (created from the Interpolated Tops tool) will add it automatically to WellBase and can be displayed in GVERSE Geomodeling. Open WellBase to check the new picks.

- You can also open or create an interpretation in GVERSE Geomodeling to see the new picks.

- In ZoneManager add the new Interpolated values. Those new attribute values can be used to create an IsoMap and to display the layer in GeoAtlas.

- Go to ZoneManager > Layer > Create IsoMap Layer. Select the Zone Name, Attribute Name and a new Layer Name and click OK.

- In the IsoMap Build Surface: Create Layer – Display Options select the type of Contours, Color Fill, Grid, Data Points, etc. and click Finish.

- Open GeoAtlas and Display the new layer there.
