Python is a high-level, general-purpose programming language often used to build websites and software, automate tasks, and conduct data analysis. The Python SDR for GeoGraphix leverages machine learning and artificial intelligence on your data in GeoGraphix projects through Python. Run scripts written in the Python programming language on well, grids, and seismic, or interact with GeoGraphix project information, well filters, stratigraphic columns and source list, well headers, log curves, formation and fault picks production data, completion data, surveys, time-depth tables and more. This blog will explain how to start using the Python API in GVERSE GeoGraphix:
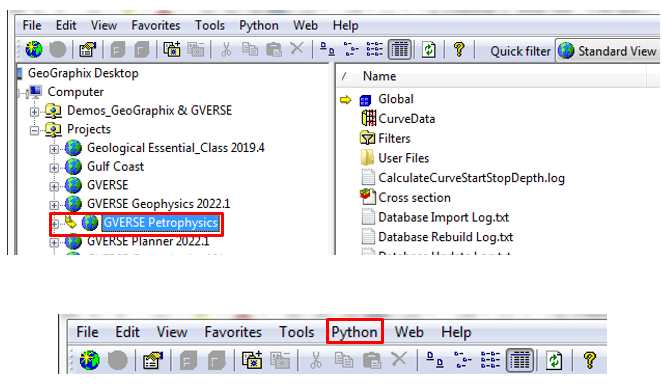
- Activate a project in GVERSE GeoGraphix and in ProjectExplorer click Python to open the Python interface.
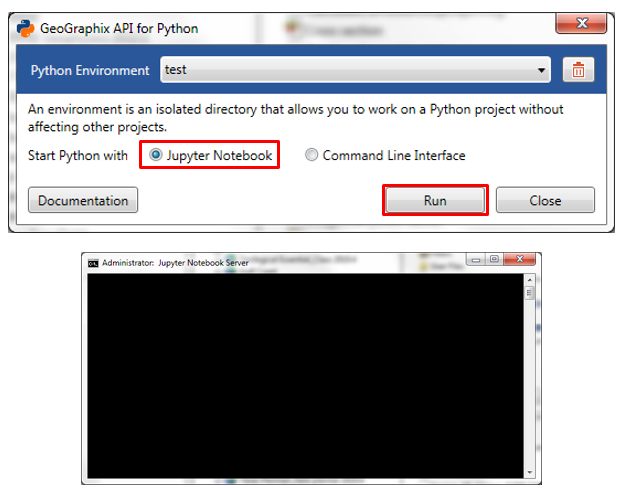
- The GeoGraphix API for Python window will open. In Start Python with, you can select either Jupyter Notebook (web application for creating and sharing computational documents)or Command Line Interface (text based user interface used to run programs, interact with the computer, etc.)
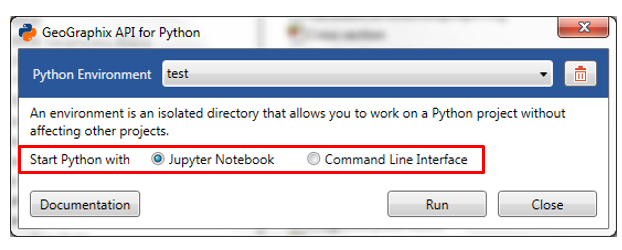
- Select Jupyter Notebook and click on Run. The Jupyter notebook will open, wait for the process to be done.
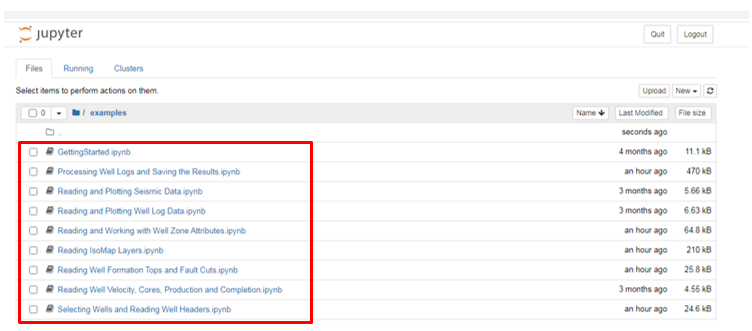
- The Jupyter library will open. On the Files tab click on the examples folder.

- The examples folder will expand and nine pre-loaded python scripts will display.
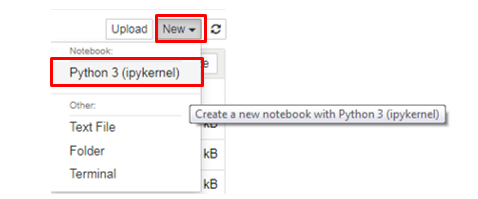
- Click on New and select any of the options to create a new notebook.
- Click Upload to import a script.

- Click on the Running tab, all the running scrips will display there.

- Go to Clusters tab and click on the IPython parallel link to install the cluster. IPython parallel (
ipyparallel) is a Python package and collection of CLI scripts for controlling clusters of IPython processes, built on the Jupyter protocol.
- On the Files tab, click on one of the scrips (for this example click on GettingStarted).

- The script will display in a new tab.
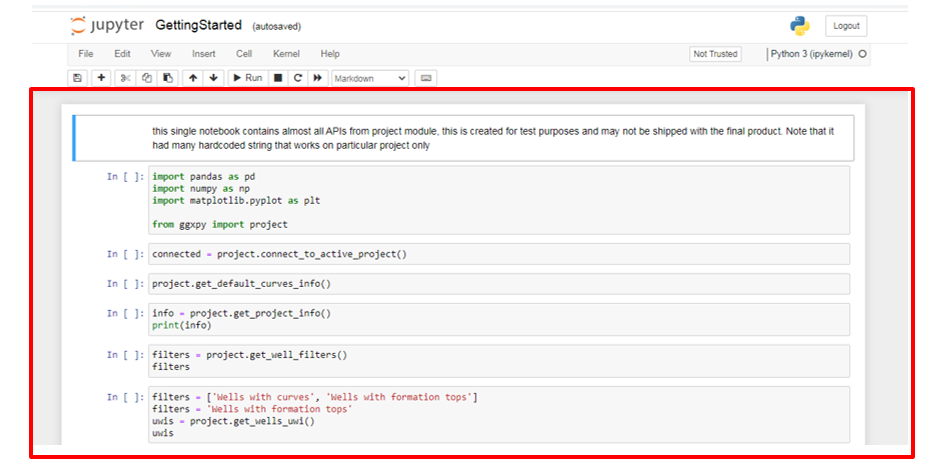
- To run the script select each input (when the input is selected a blue line will appear) and click Run.

- After running the script a number will appear inside the In () and jump to the next line.

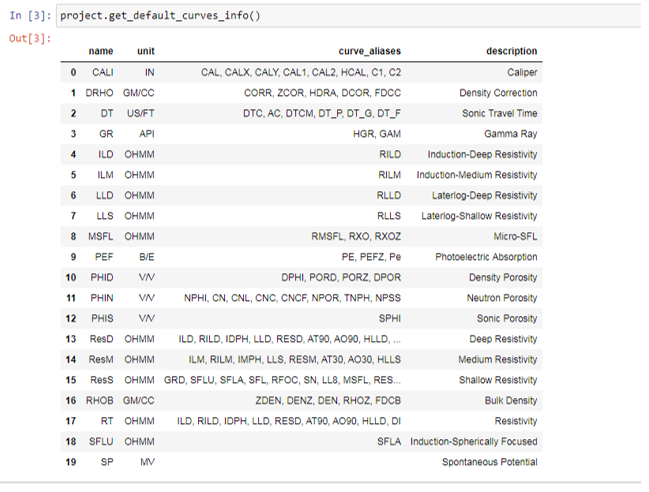
- Repeat the process for each script. Each script will display different information, such as tables, graph etc. Here you can see curve information in the project:
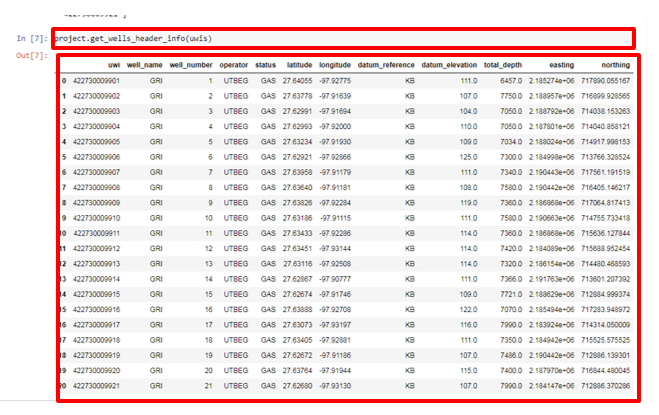
- Wells header information:
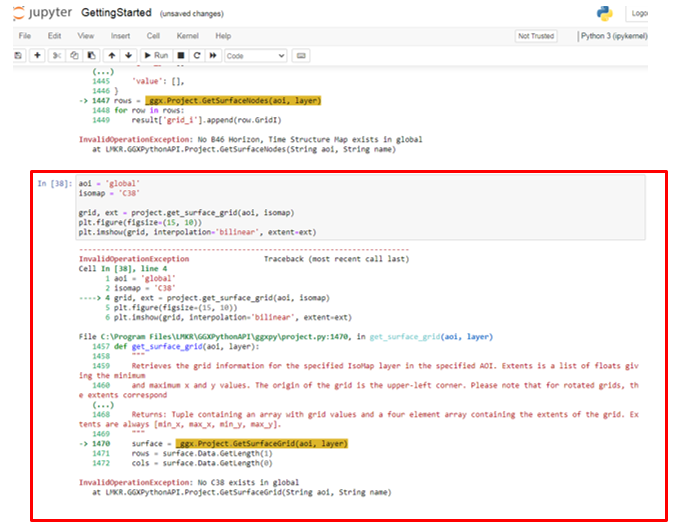
- If one of the scripts is not valid or has an error, the script will show and explain the error.
- After running the script the data analysis or the new data created by the script will automatically get imported into the project.
Importing new curve set into a GeoGraphix project:
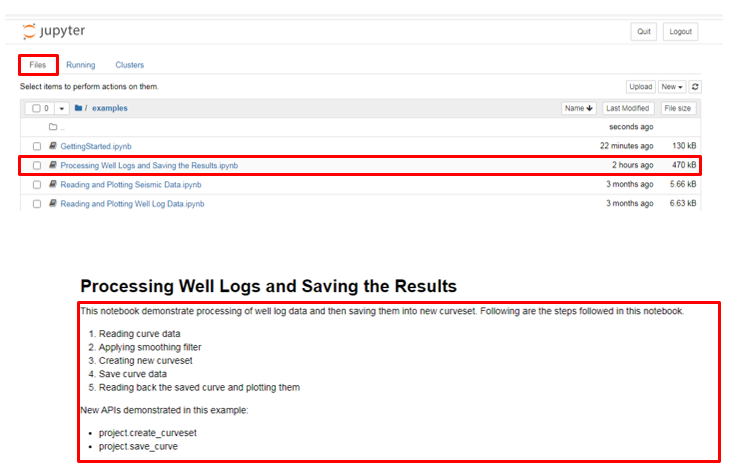
- In Files click on Processing Well Logs and Saving the Results script. The work flow for this script will display.
- Run the scripts by selecting the script line and clicking the run bottom.
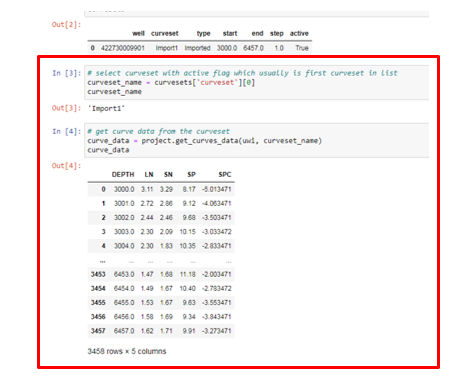
- The smooth curve filter in the script will be applied to the curves.
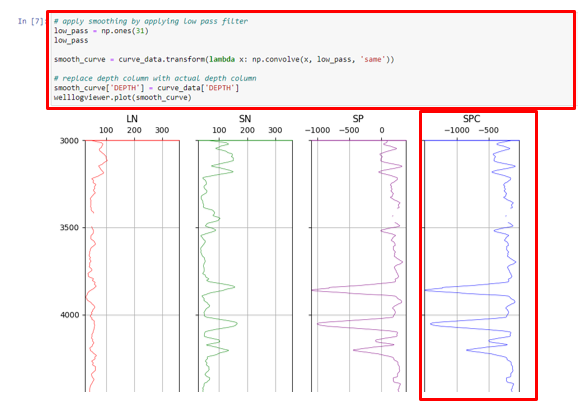
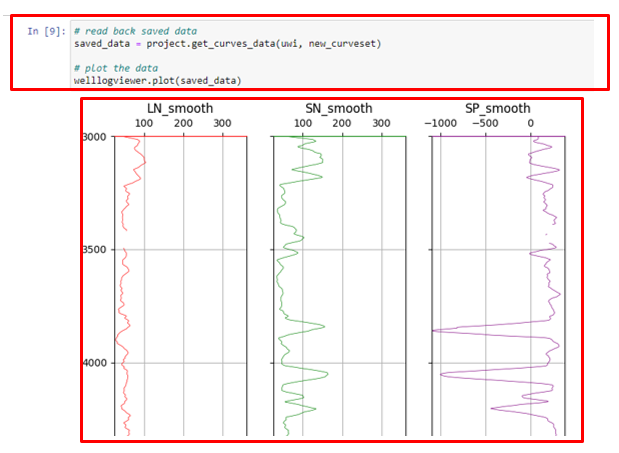
- The smooth curves are created and saved in the project under a new Curve Set.
- After running the script open GVERSE Petrophysics.
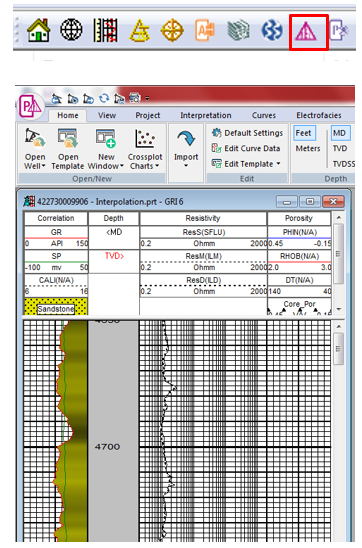
- Select the well where the smooth curves were calculated and the new set created.
- Go to the Project tab and click on Assign Field Data and in its window check the Curve Set. A smooth curve set will appear.
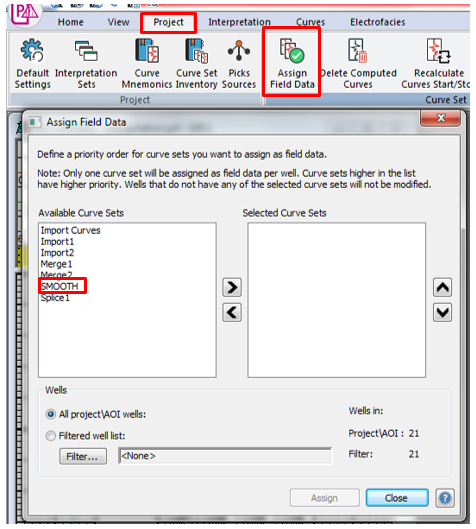
- If you are not sure which wells have the new smooth curves, go to Project tab and click on Curve Set Inventory.

- In the Curve Set Inventory window you can look for the well(s) with the smooth curves.
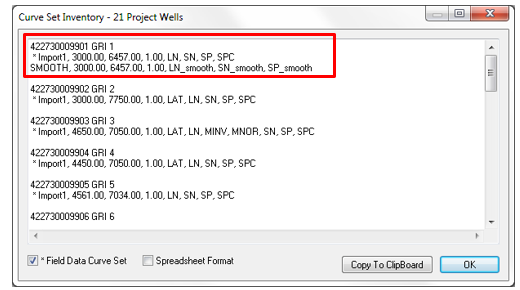
- If you want to compare the original curve with the smooth curve, in the well right-click and select Add Log Track.
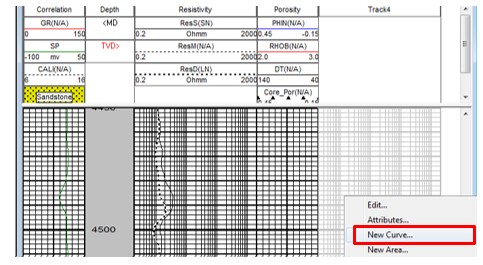
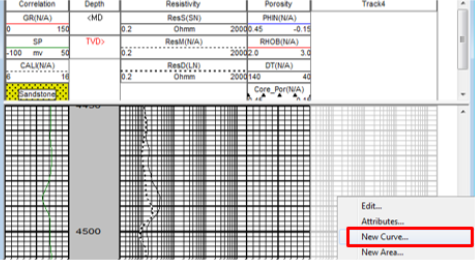
- The new track will appear. Right-click on the track and select New Curve.
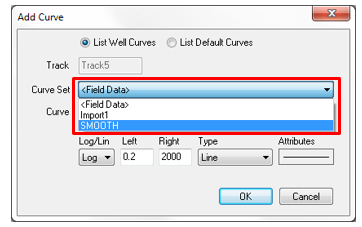
- The Add Curve window will appear. Under Curve Set select SMOOTH curve set.
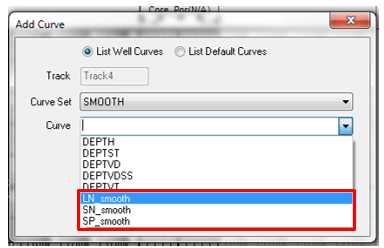
- Under Curve select the smooth curve(s).

- Apply the changes in the track and add the extra smooth curves if necessary.
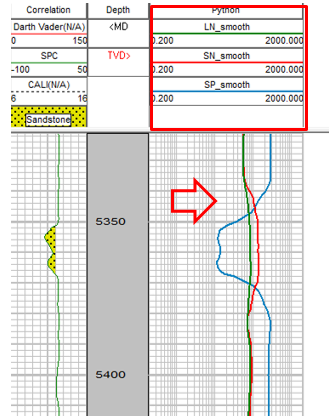
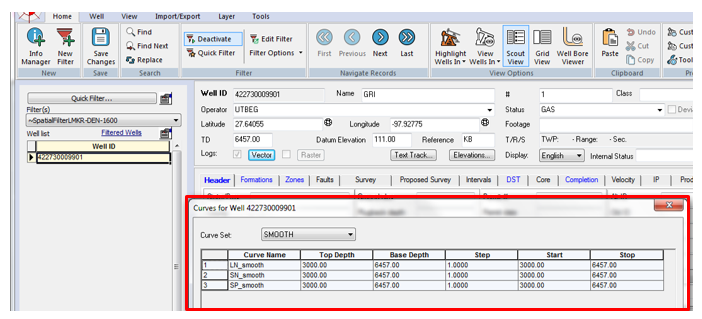
- The curve data for this well will also be added to WellBase.
